Menafsirkan histogram
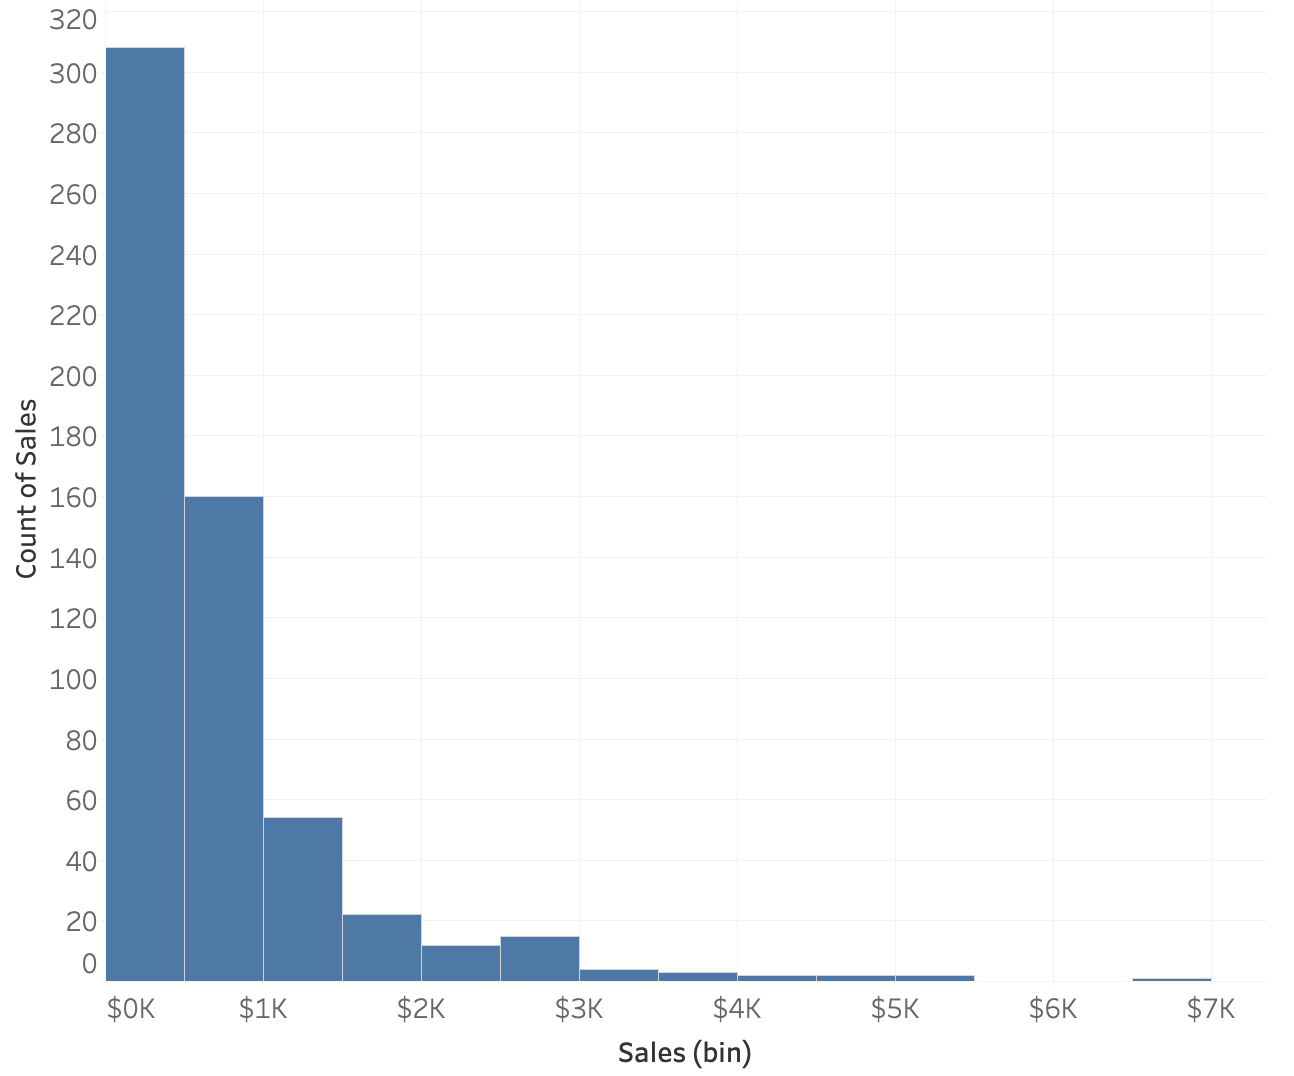
Berikut adalah histogram penjualan pesanan perlengkapan kantor. Setiap baris dalam himpunan data merepresentasikan satu pesanan, sehingga setiap pesanan memiliki satu nilai penjualan.
Tip: Panel sebelah kiri pada latihan ini yang berisi teks dan instruksi dapat diubah ukurannya. Jika plot terlalu kecil untuk dilihat dengan jelas, Anda dapat menyeretnya untuk memperbesar.
Latihan ini merupakan bagian dari kursus
Teknik Statistik di Tableau
Latihan interaktif langsung
Ubah teori menjadi aksi dengan salah satu latihan interaktif kami
 Mulai latihan