Mengurai performa kampanye
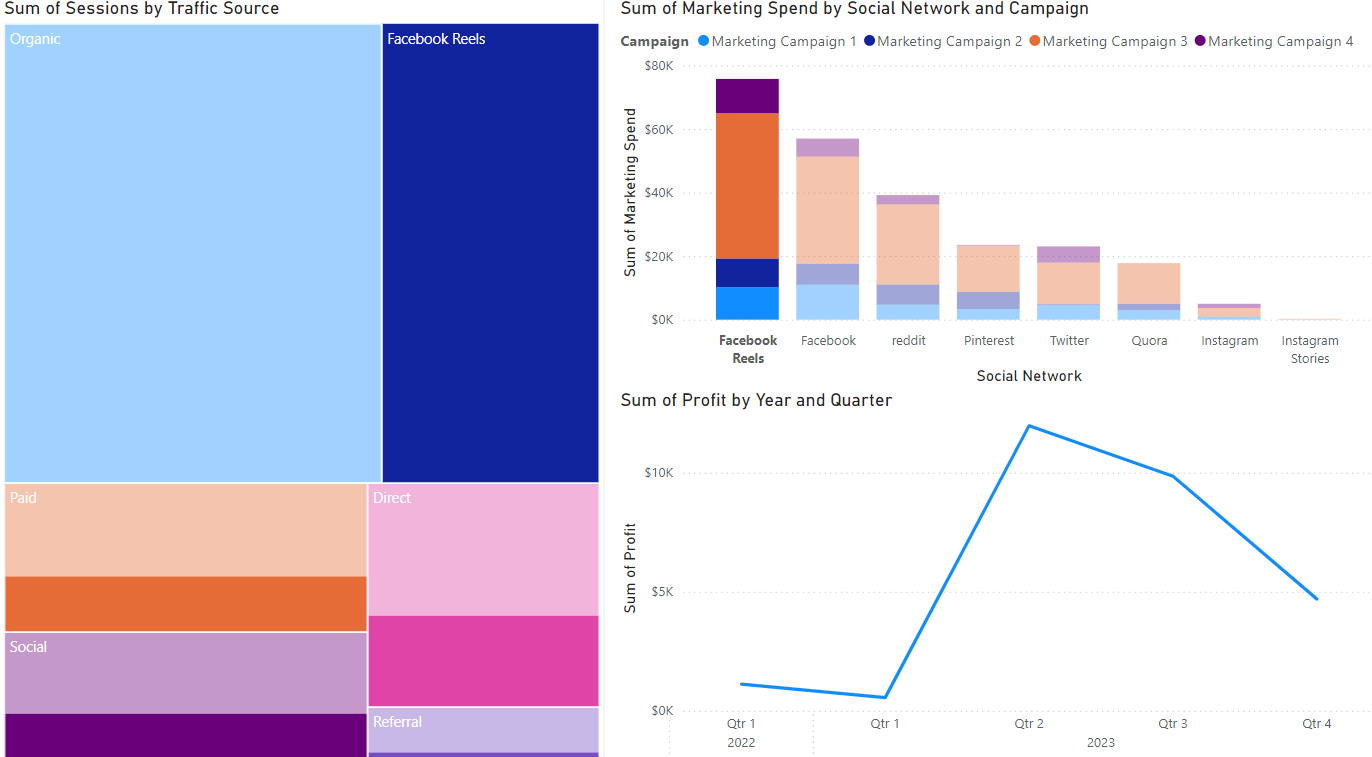
Saatnya analisis kampanye! Misalnya Anda membuat tree map (sesi berdasarkan sumber trafik), bagan batang (pengeluaran pemasaran per kanal), dan grafik garis (laba). Tampilan default tab laporan Anda ditunjukkan di bawah ini.
Mari gunakan visualisasi Power BI ini untuk membedah kampanye paling menguntungkan dan mengidentifikasi peluang optimasi.
Latihan ini merupakan bagian dari kursus
Power BI untuk Pengguna Akhir
Latihan interaktif langsung
Ubah teori menjadi aksi dengan salah satu latihan interaktif kami
 Mulai latihan