Apa yang dapat diberitahukan oleh korelasi kepada Anda?
Pada latihan sebelumnya, Anda melihat hubungan negatif yang lemah hingga sedang antara biaya sebotol air dan jumlah jam kerja tahunan di berbagai kota. Berikut plotnya sebagai pengingat:
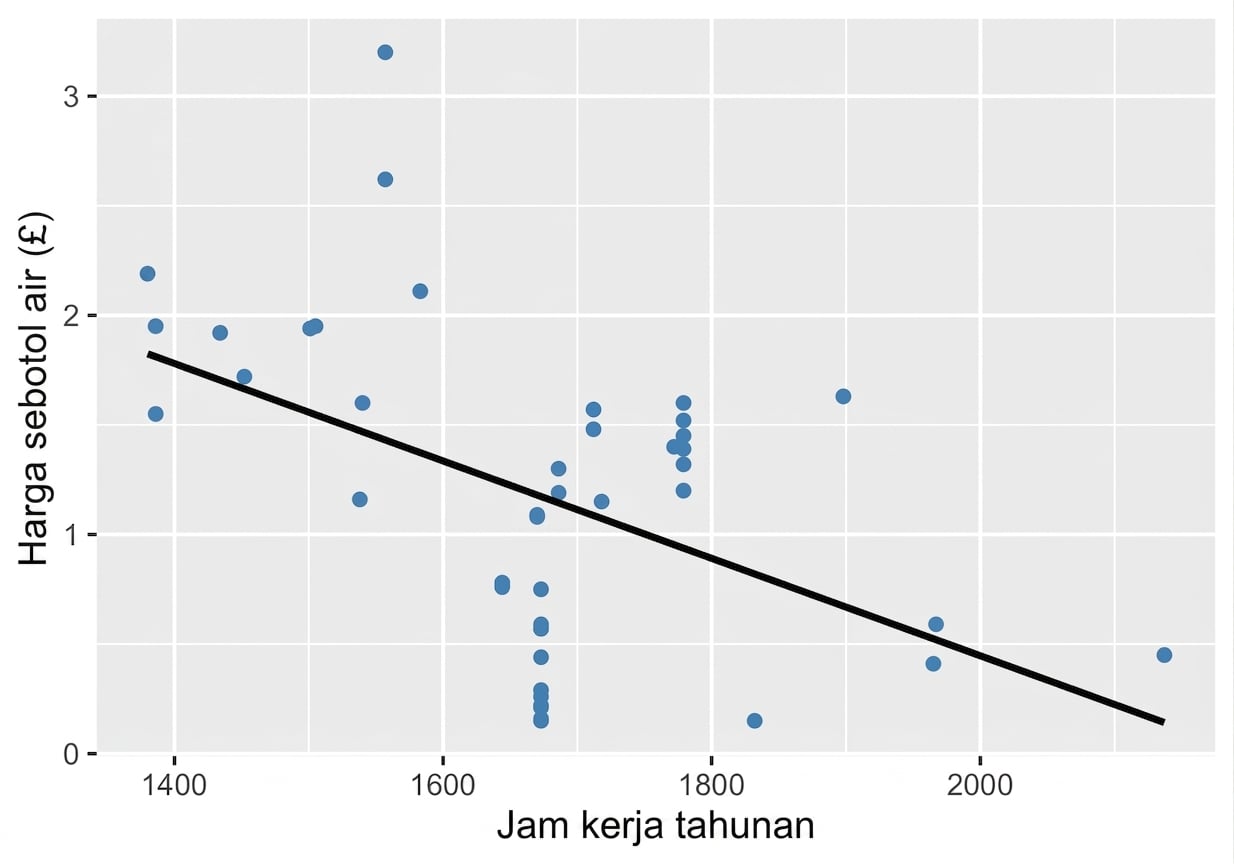
Tugas Anda adalah memilih pernyataan yang secara akurat menggambarkan apa yang secara wajar dapat Anda simpulkan dari visualisasi ini.
Latihan ini merupakan bagian dari kursus
Pengantar Statistika
Latihan interaktif langsung
Ubah teori menjadi aksi dengan salah satu latihan interaktif kami
 Mulai latihan