Berita menyesatkan?
Selamat malam; berikut pembaruan berita harian Anda. Hari ini, kami membawa laporan yang mengkhawatirkan tentang meningkatnya jumlah PHK yang membuat banyak individu dan keluarga menghadapi masa depan yang tidak pasti. Mari kita lihat data lebih dekat..
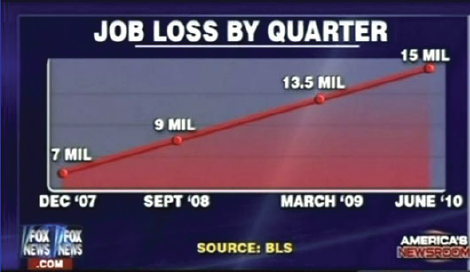
Sumber: https://www.businessinsider.com/the-27-worst-charts-of-all-time-2013-6
Sebagai calon pakar visualisasi data, Anda pasti dapat mendeteksi beberapa masalah pada bagan ini. Selain ketidaksempurnaan pemformatan yang cukup jelas, bagan ini sangat menyesatkan.
Dapatkah Anda mengidentifikasi alasan mengapa bagan ini menyesatkan?
Latihan ini merupakan bagian dari kursus
Visualisasi Data di Excel
Latihan interaktif langsung
Ubah teori menjadi aksi dengan salah satu latihan interaktif kami
 Mulai latihan