Berapa banyak home run?
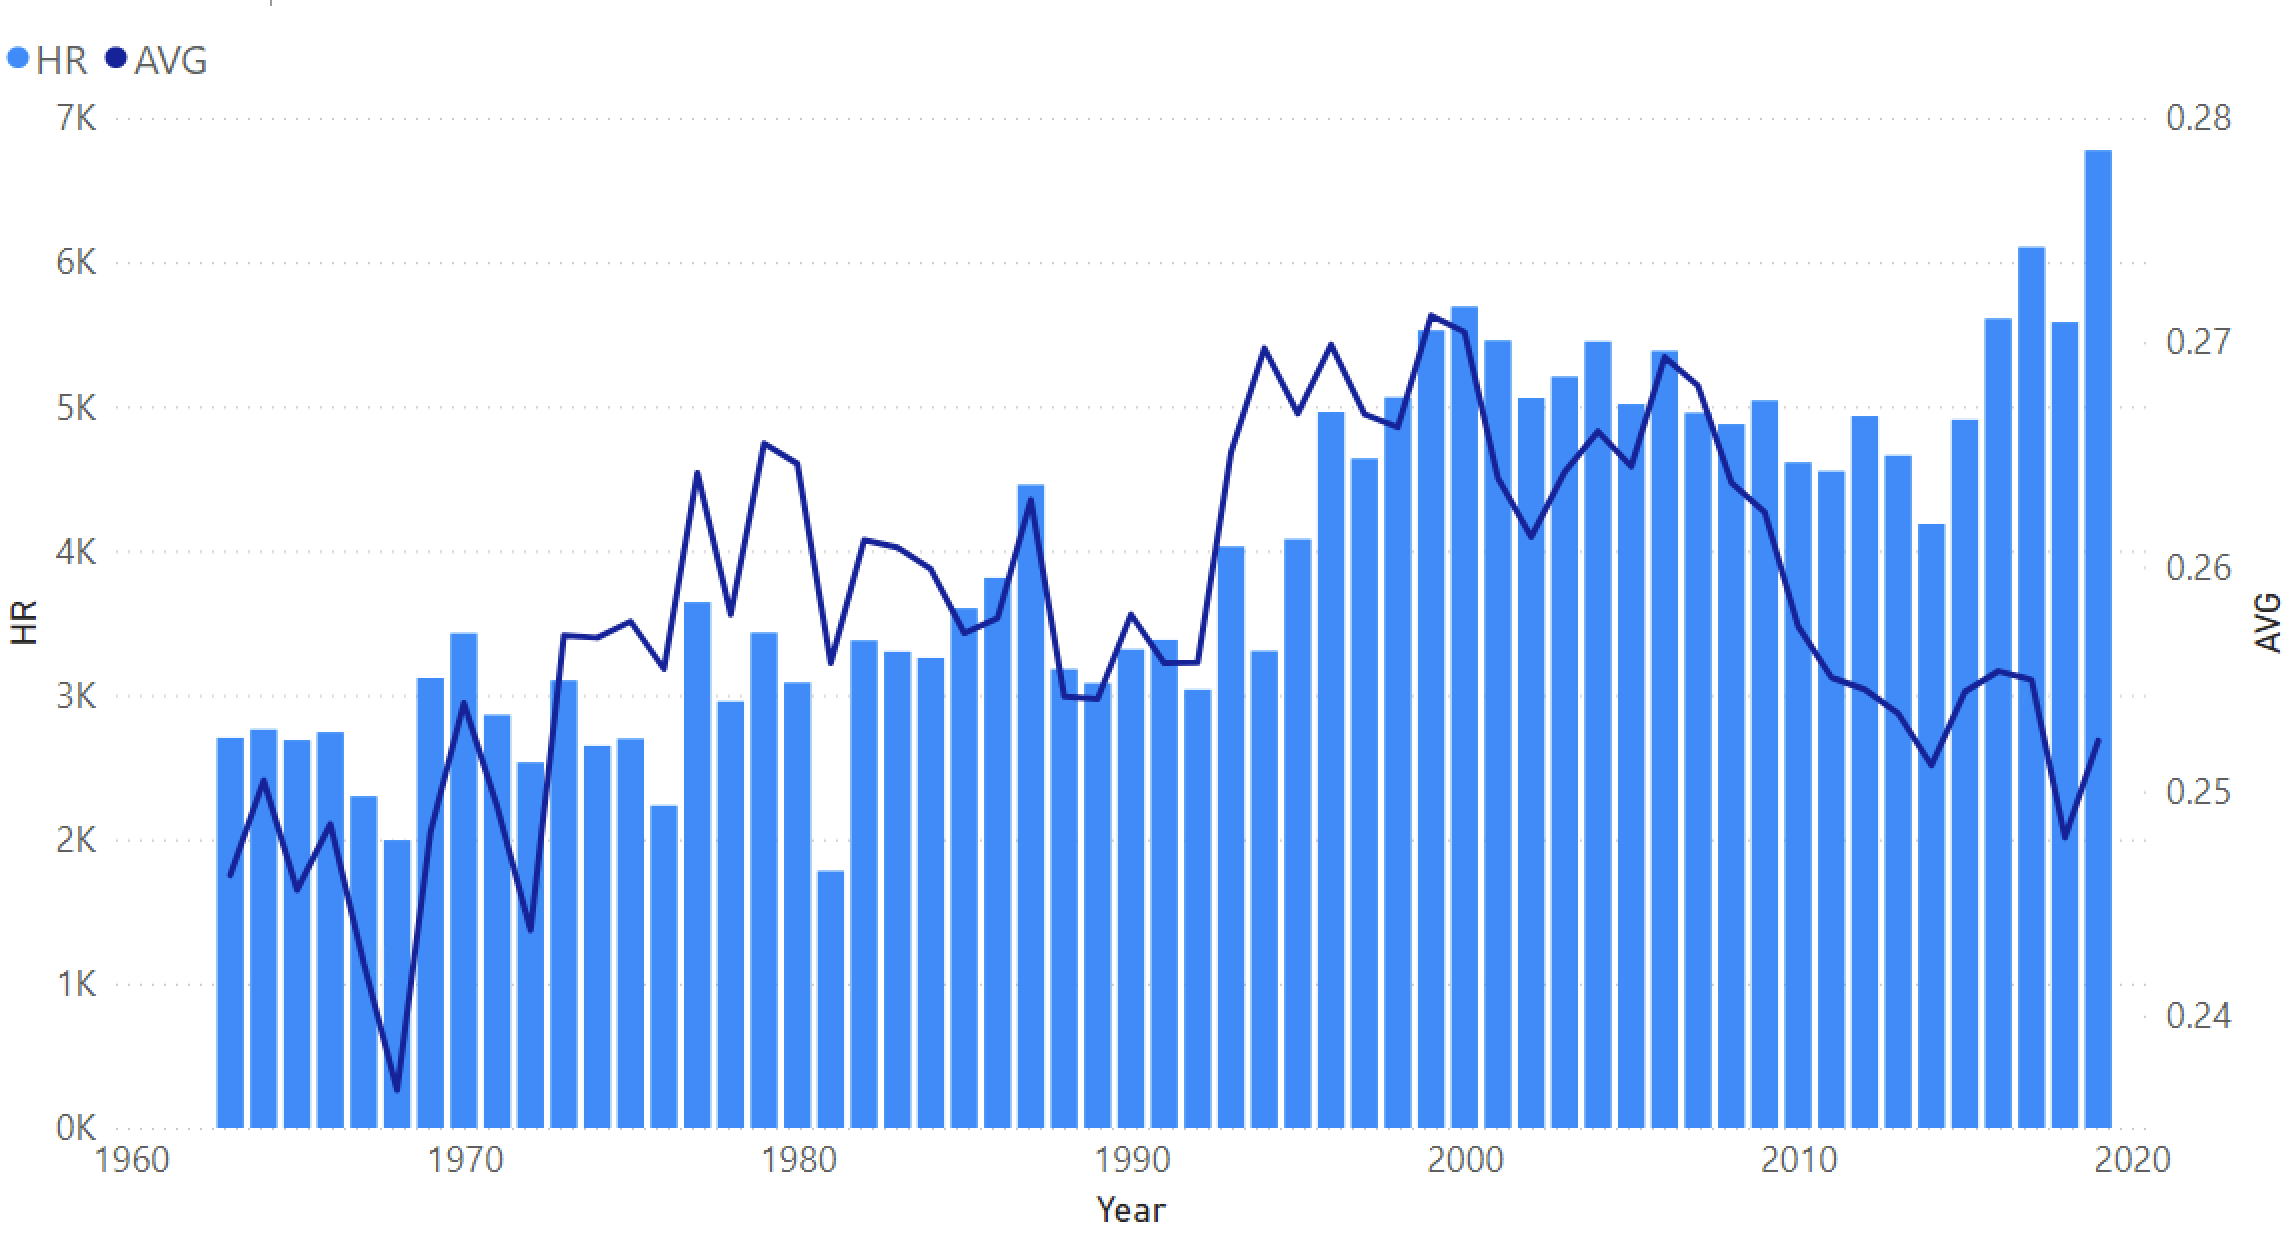 Berdasarkan visual bagan garis dan kolom berkelompok yang Anda buat pada latihan sebelumnya, tahun berapakah dalam periode 1963 hingga 2019 yang memiliki jumlah home run (HR) paling sedikit?
Latihan ini merupakan bagian dari kursus
Visualisasi Data Baseball di Power BI
Latihan interaktif langsung
Ubah teori menjadi aksi dengan salah satu latihan interaktif kami
 Mulai latihan