Ages, interest rates and the whole life annuity
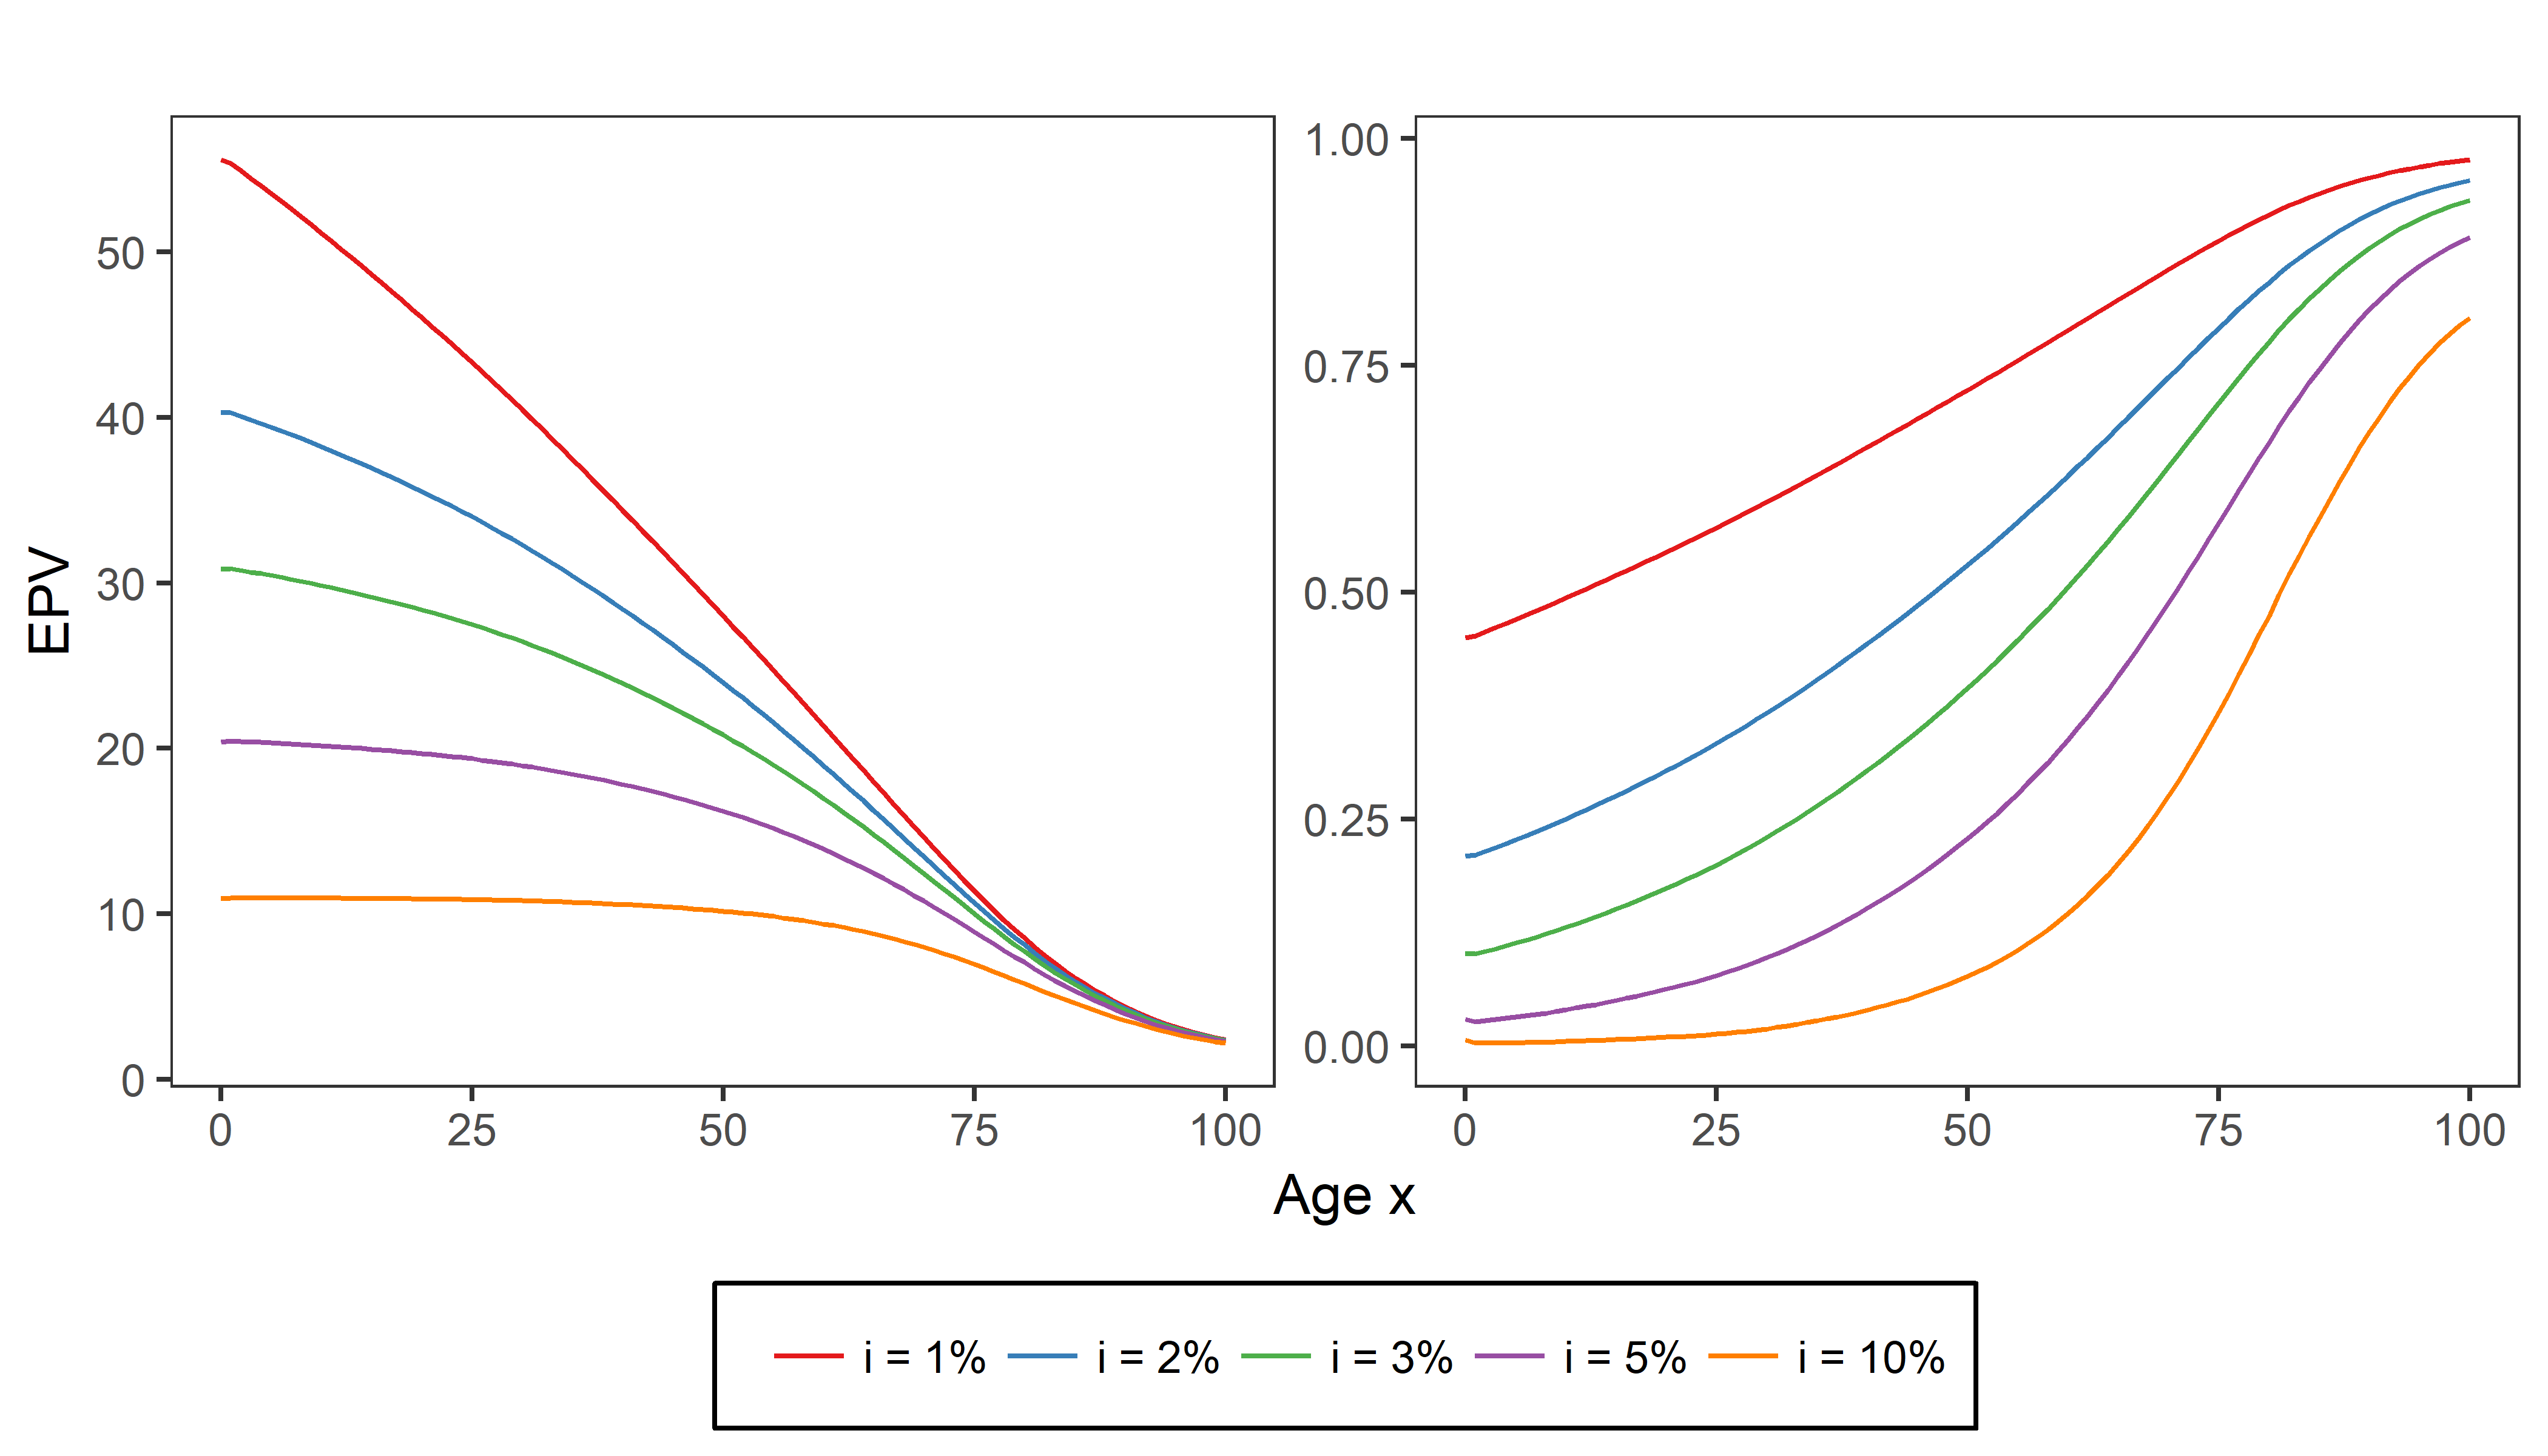
To gain some intuition, Cynthia plotted the expected present values \(\ddot{a}_x\) of a whole life annuity due (with constant benefits of 1 EUR) for varying ages \(x\) from 0 to 100 and for five different interest rates \(i\). Which of the following two figures corresponds to this graph?
यह अभ्यास पाठ्यक्रम का हिस्सा है
Life Insurance Products Valuation in R
इंटरैक्टिव व्यावहारिक अभ्यास
हमारे इंटरैक्टिव अभ्यासों में से किसी एक के साथ सिद्धांत को व्यवहार में बदलें
 अभ्यास शुरू करें