Scale-location
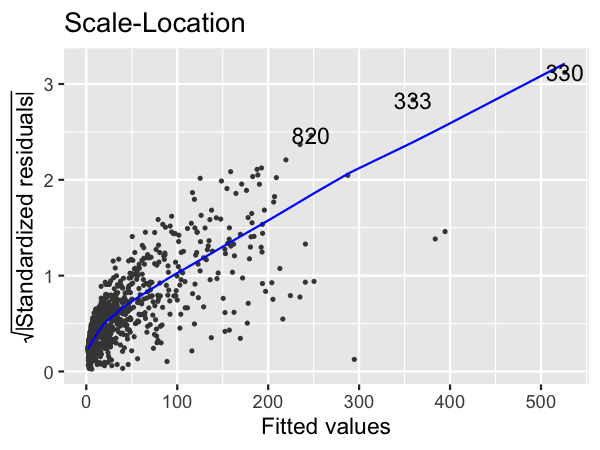
Here are normal scale-location plots of the previous two models. That is, they show the size of residuals versus fitted values.
Original model (n_clicks versus n_impressions)
Transformed model (n_clicks ^ 0.25 versus n_impressions ^ 0.25)
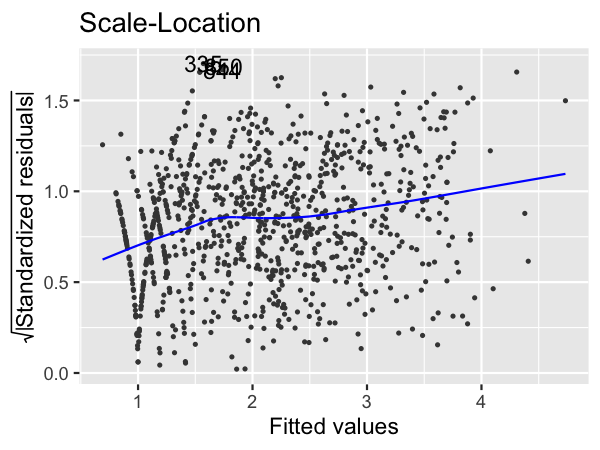
Look at the numbers on the y-axis and the slope of the trend line. Which statement is true?
यह अभ्यास पाठ्यक्रम का हिस्सा है
Introduction to Regression in R
इंटरैक्टिव व्यावहारिक अभ्यास
हमारे इंटरैक्टिव अभ्यासों में से किसी एक के साथ सिद्धांत को व्यवहार में बदलें
 अभ्यास शुरू करें