रंग सेट करना
रंग-आधारित status सेटिंग्स के अलावा, valueBox() और infoBox() जैसे ऑब्जेक्ट्स के लिए और भी रंग सेट किए जा सकते हैं।
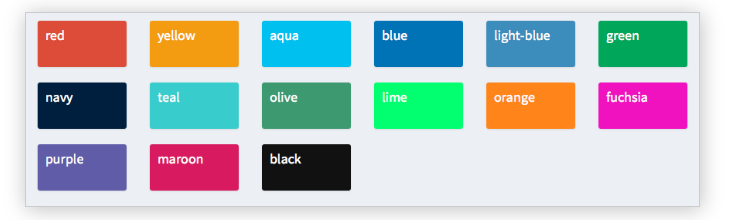
आगे, आप shinydashboard के बॉडी में अलग-अलग रंग सेट करेंगे, हालाँकि इन ऑब्जेक्ट्स को हम पहले के उदाहरण की तरह server() में भी परिभाषित कर सकते हैं।
इस अभ्यास में, shiny और shinydashboard लाइब्रेरी आपके लिए पहले से लोड की गई हैं। इसके अलावा, हेडर और साइडबार क्रमशः header और sidebar के रूप में स्टोर किए गए हैं, और server() एक खाली फंक्शन है।
यह अभ्यास पाठ्यक्रम का हिस्सा है
shinydashboard के साथ डैशबोर्ड बनाना
इंटरैक्टिव व्यावहारिक अभ्यास
इस अभ्यास को इस नमूना कोड को पूरा करके आज़माएँ।
library(shiny)
library(shinydashboard)

header <- dashboardHeader(
  title = "Portfolio dashboard for Sally",
  titleWidth = 300,
  dropdownMenu(type = "notifications",
       notificationItem("Sell alert", status = "danger"),
       notificationItem("Buy alert", status = "success"))
)

sidebar <- dashboardSidebar(
  width = 300,
  sidebarMenu(
    id = "pages",
    menuItem("Historical trends",
             tabName = "historical"),
    menuItem("Profits and Losses (PnLs)",
             tabName = "profit",
             icon = icon("money-bill-alt"),
             badgeLabel = "+2.3%", badgeColor = "green")
  )
)

body <- dashboardBody(tabItems(
  tabItem(tabName = "historical",
          fluidRow(box(selectInput("stock", "Select stock symbol",
                                   choices=c("AAPL", "DIS"))),
                   box("Stock name",
                       title="Stock name title",
                       width = 6,
                       status = "info", solidHeader = TRUE)),
          # Set the color of each infoBox to black
          fluidRow(infoBox("Open", "value", width = 2, color = ___),
                   infoBox("High", "value", width = 2,___),
                   infoBox("Low", "value", width = 2, ___),
                   infoBox("Close", "value", width = 2, ___),
                   # Set the color of the last infoBox to navy and set its width to 4
                   infoBox("Volume", "value", ___)),
          fluidRow(valueBox("Open (%)", "0%", width = 2),
                   valueBox("High (%)", "+1%", width = 2),
                   valueBox("Low (%)", "-4%", width = 2),
                   valueBox("Close (%)", "-2%", width = 2),
                   valueBox("Volume (%)", "+30%", width = 2)),
          fluidRow(box("Candlestick chart", width = 12, height = 350)),
          fluidRow(box("Volume chart", width = 12, height = 200))),
  tabItem(tabName = "profit",
          fluidRow(box("valueBox", "Account balance", width = 3),
                   box("valueBox",  "Value at Risk (Var)", width = 3),
                   box("valueBox", "Returns", width = 3),
                   box("valueBox", "Profit-to-loss ratio", width = 3)),
          fluidRow(box("PnL chart", width = 12, height = 400)))
)
)

ui <- dashboardPage(header, sidebar, body)
server <- function(input, output){}
shinyApp(ui, server)