Techniques pour détecter les anomalies
Comme nous l’avons vu dans les vidéos, il existe plusieurs façons d’identifier des valeurs anormales.
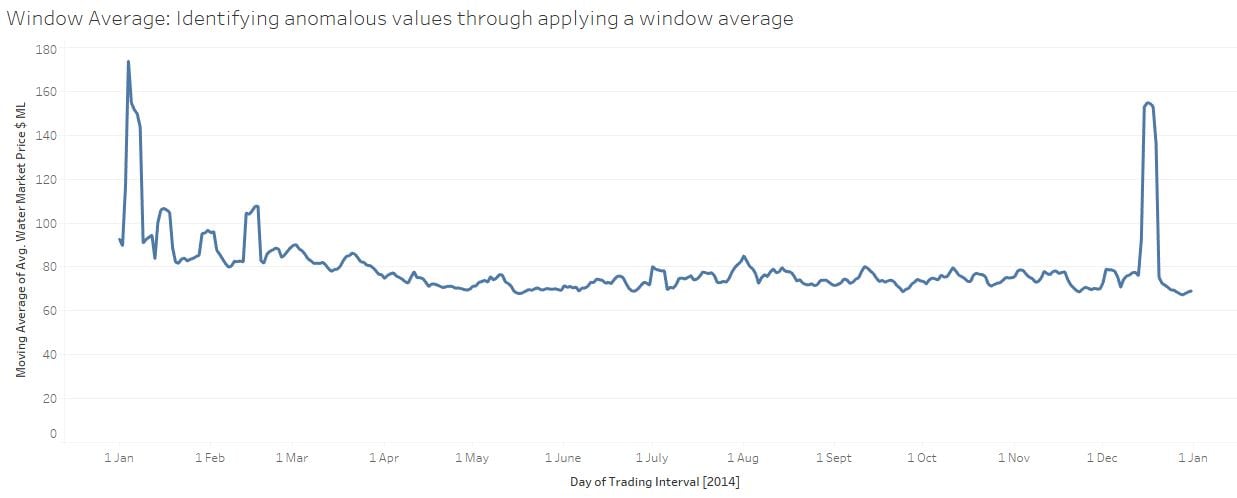
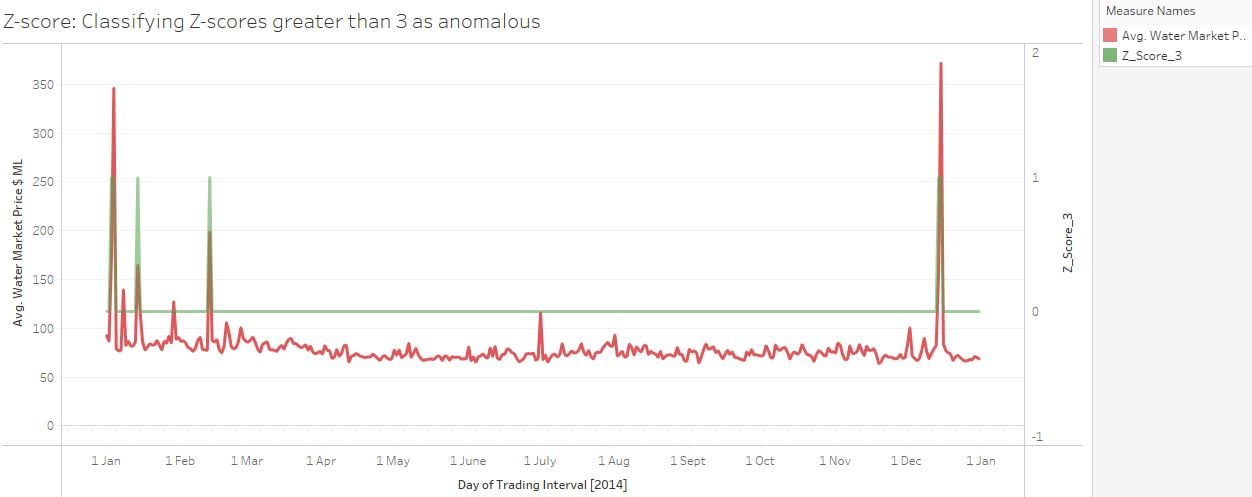
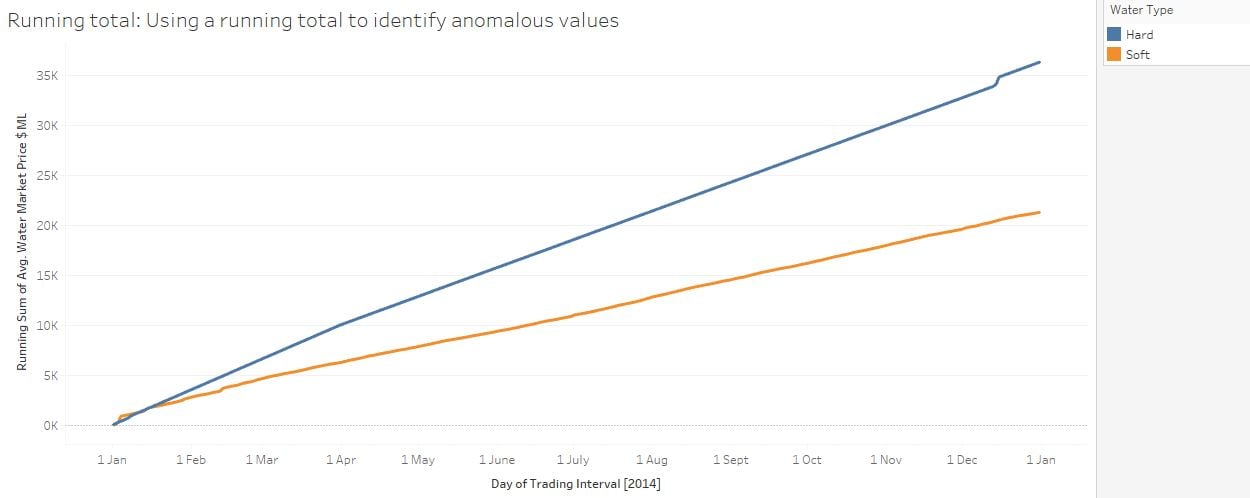
Nous avons créé une série de visualisations qui peuvent illustrer des techniques de détection d’anomalies.
Laquelle des options ci-dessous n’est pas une technique valide pour identifier des valeurs anormales ?
Examinez les visuels ci-dessous !
Cet exercice fait partie du cours
<cours>Analyse des séries temporelles avec Tableau</cours>Exercice interactif pratique
Transformez la théorie en action avec l’un de nos exercices interactifs
 Commencer l’exercice