Combien de home runs ?
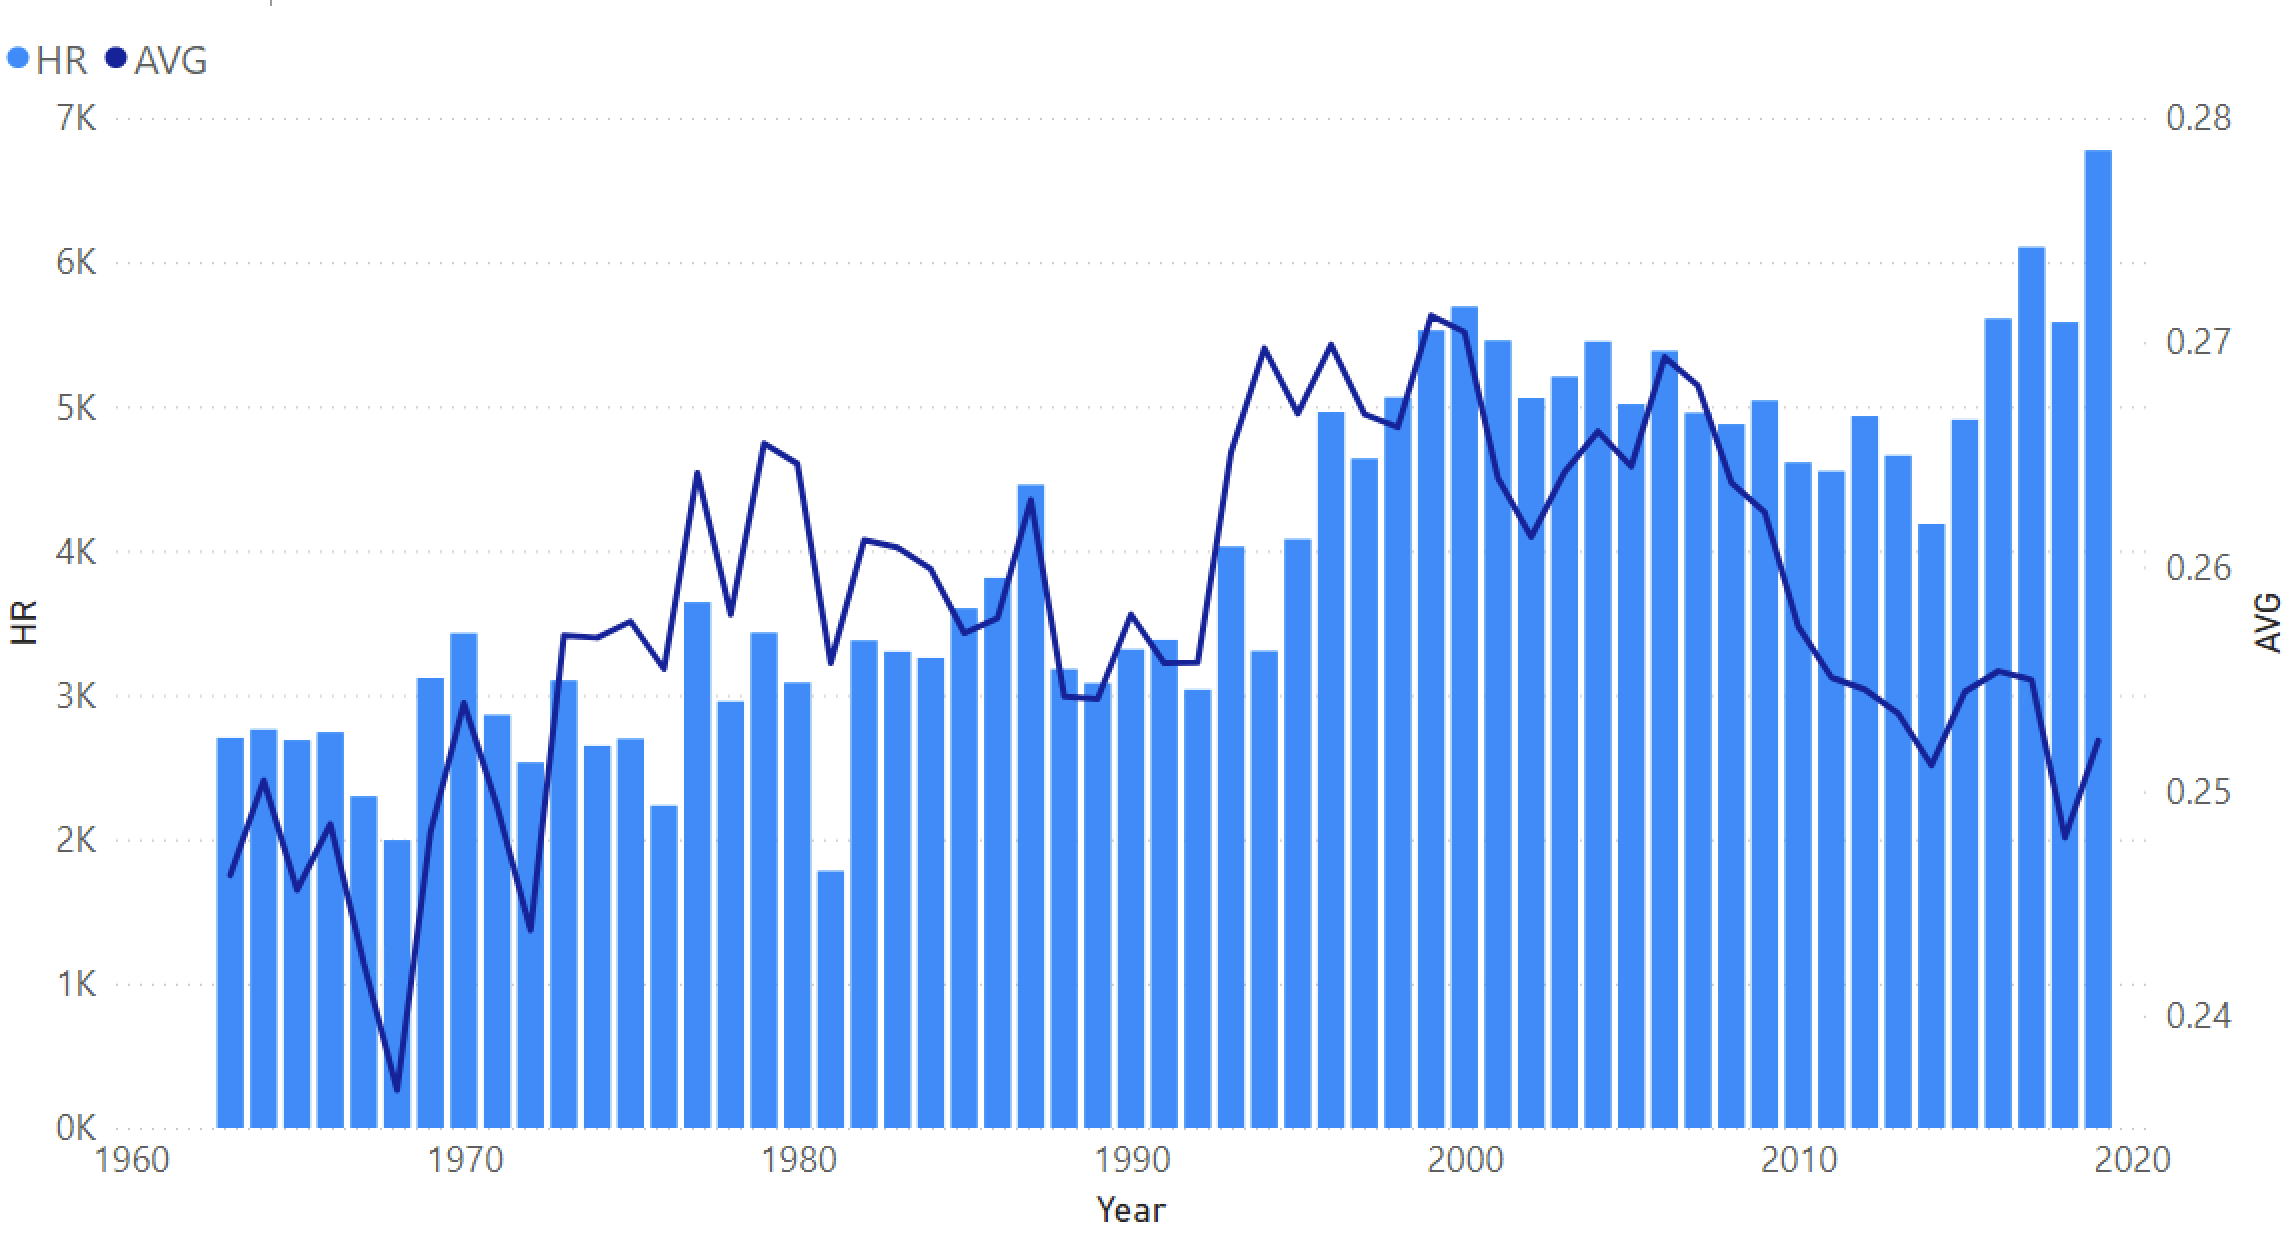 En vous appuyant sur le graphique à lignes et colonnes groupées créé dans l’exercice précédent, quelle année, entre 1963 et 2019, compte le plus petit nombre de home runs (HR) ?
Cet exercice fait partie du cours
<cours>Visualisation de données de baseball dans Power BI</cours>Exercice interactif pratique
Transformez la théorie en action avec l’un de nos exercices interactifs
 Commencer l’exercice