Interpretar histogramas
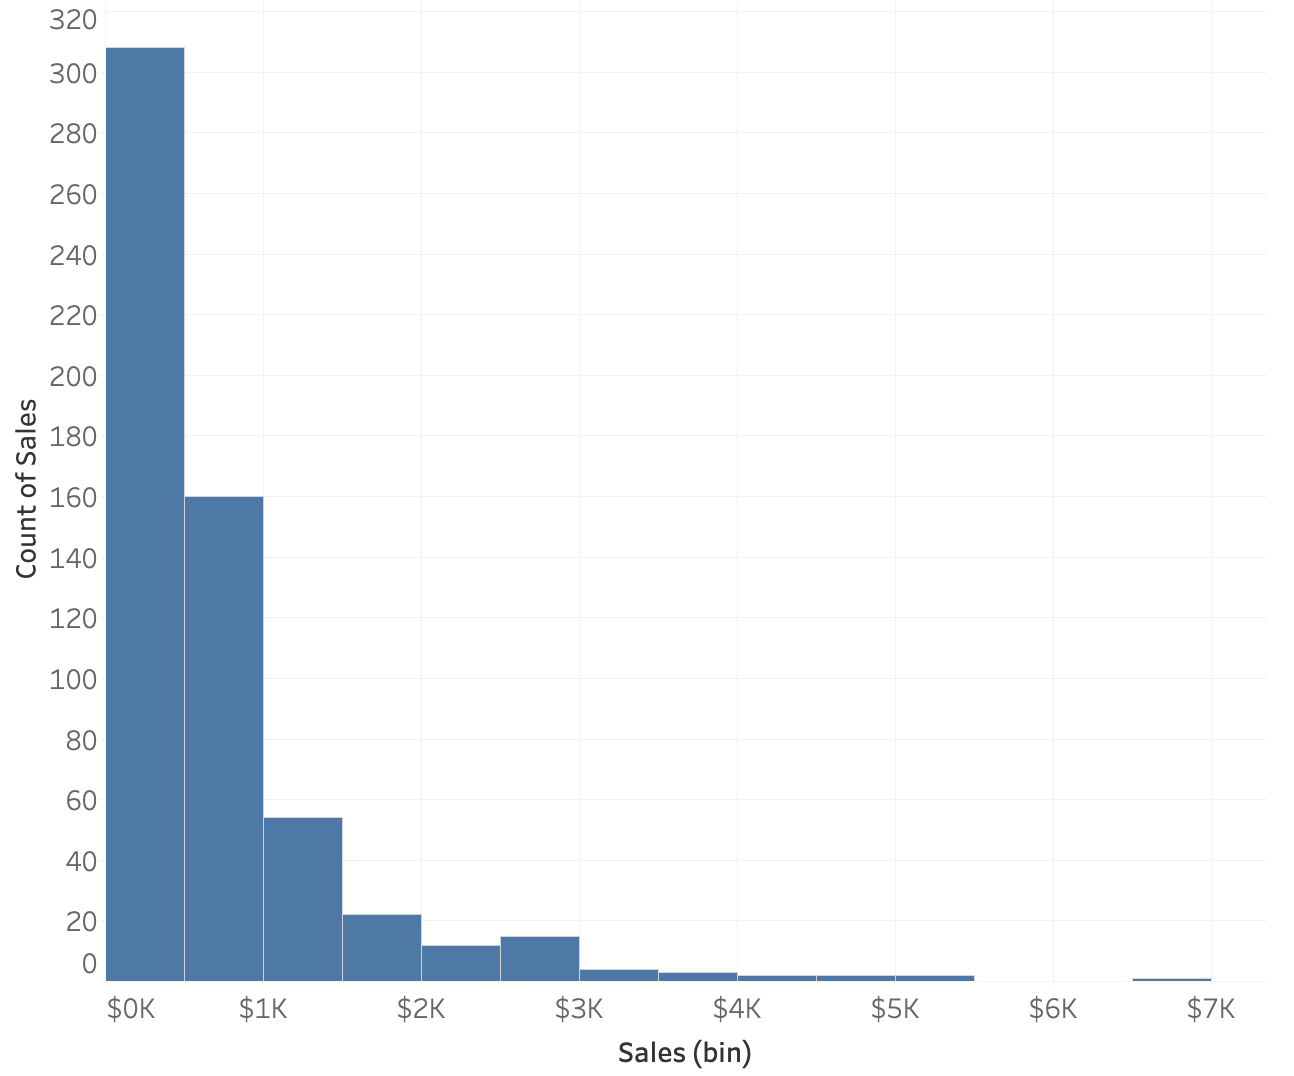
Aquí tienes un histograma de las ventas de pedidos de material de oficina. Cada fila del conjunto de datos representa un pedido, así que cada pedido tiene un único valor de venta.
Consejo: Este panel izquierdo del ejercicio con el texto y las instrucciones se puede redimensionar. Si la gráfica se ve demasiado pequeña, arrástralo para hacerla más grande.
Este ejercicio forma parte del curso
Técnicas estadísticas en Tableau
ejercicio interactivo práctico
Convierte la teoría en práctica con uno de nuestros ejercicios interactivos
 Empezar ejercicio