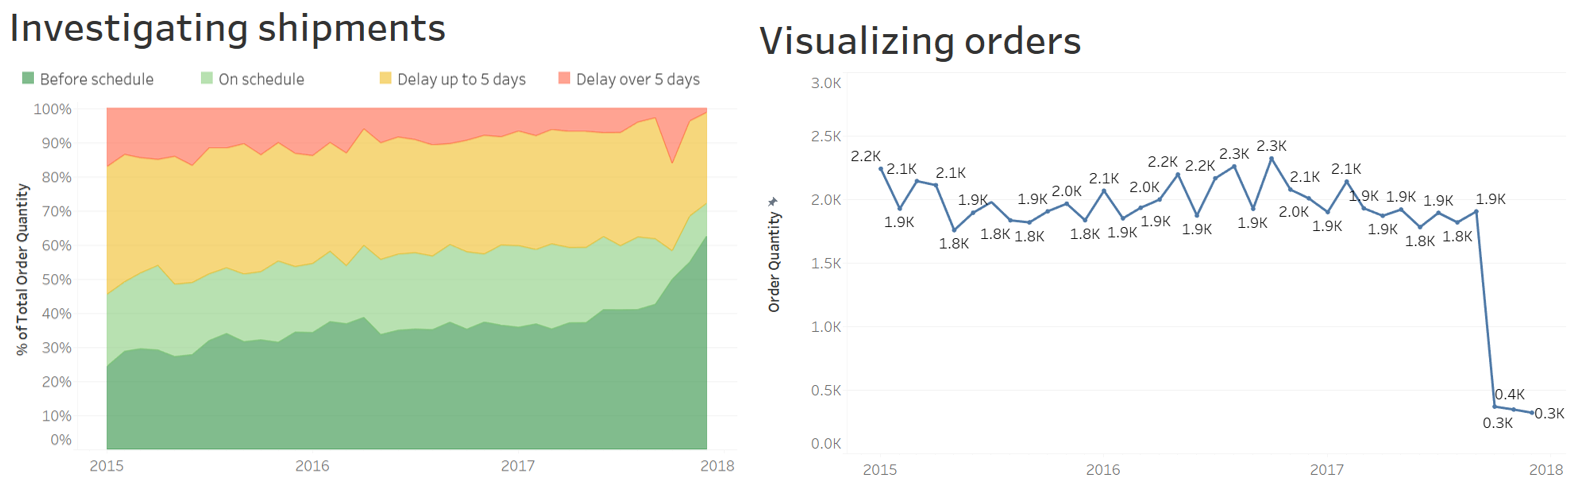
Sacar conclusiones a partir de los gráficos
¿Qué frase(s) resumen correctamente estas dos visualizaciones?
Este ejercicio forma parte del curso
Estudio de caso: Analítica de la cadena de suministro en Tableau
ejercicio interactivo práctico
Convierte la teoría en práctica con uno de nuestros ejercicios interactivos
 Empezar ejercicio