How many home runs?
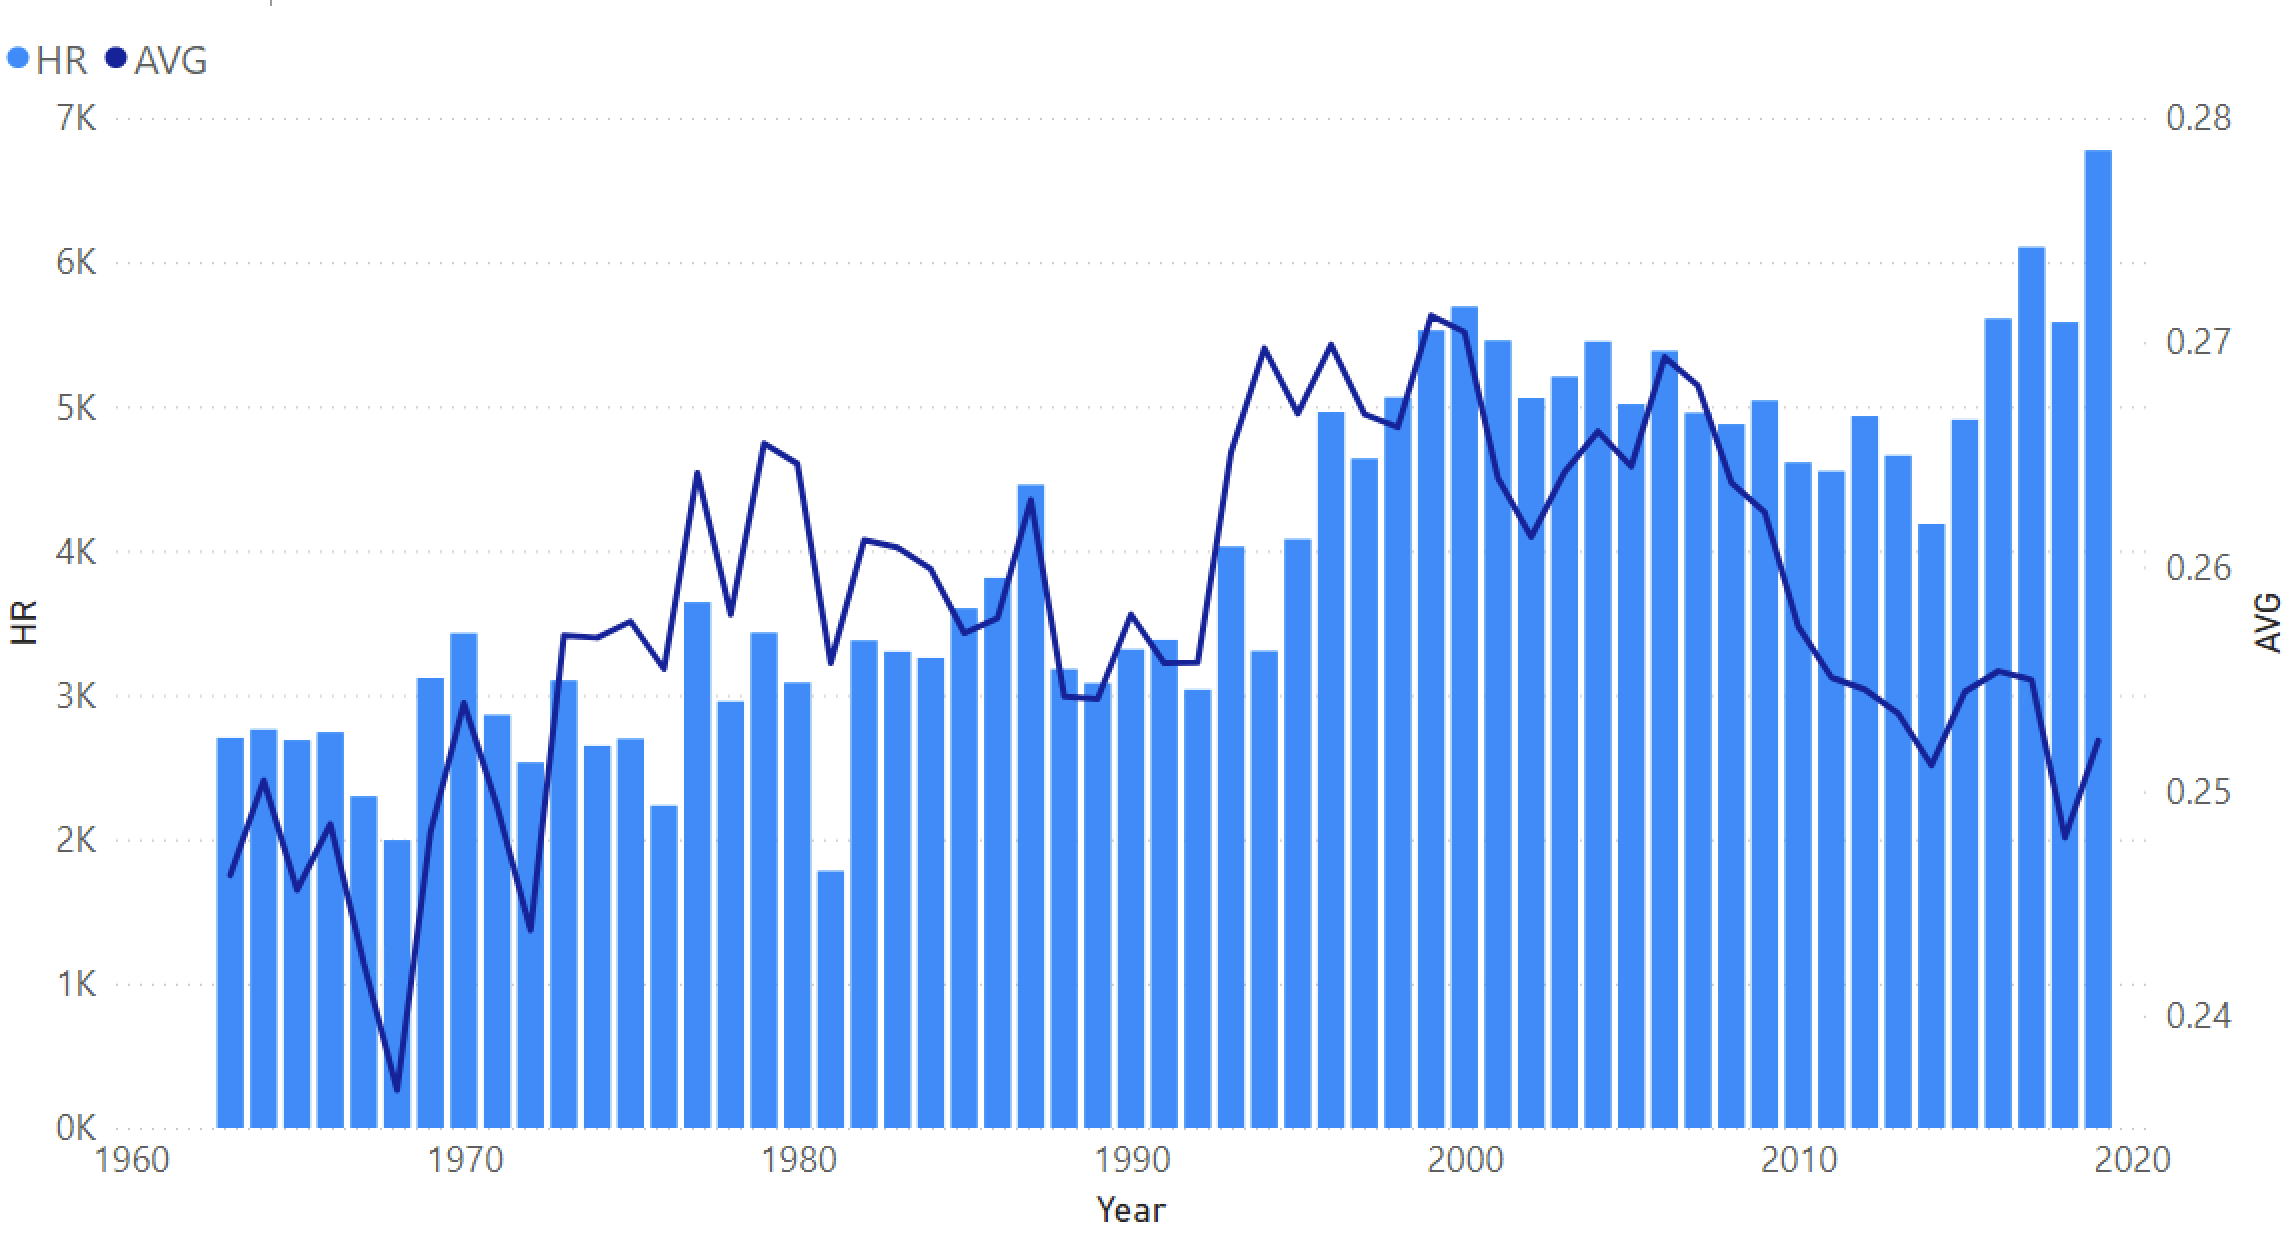 Considering the line and clustered column chart visual you created in the previous exercise, which year during the period 1963 to 2019 had the fewest number of home runs (HR)?
Este ejercicio forma parte del curso
Baseball Data Visualization in Power BI
ejercicio interactivo práctico
Convierte la teoría en práctica con uno de nuestros ejercicios interactivos
 Empezar ejercicio