Abfragen mit einem E:R-Diagramm planen
Ein E:R-Diagramm zeigt visuell alle Tabellen, Felder und Beziehungen in einer Datenbank. Du erhältst das folgende E:R-Diagramm:
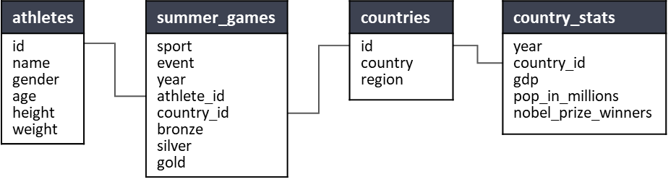
Deine Aufgabe ist es, einen Bericht zu erstellen, der Age of Oldest Athlete by Region zeigt. Welche Tabellen müssen in die Abfrage aufgenommen werden?
Diese Übung ist Teil des Kurses
<Kurs>Reporting in SQL</Kurs>Interaktive praktische Übung
Verwandle Theorie mit einer unserer interaktiven Übungen in die Praxis
 Übung starten