Best Practices für Visualisierungen
Teste dein Wissen über die Best Practices, die du bei der Auswahl der passenden Visualisierung für deinen Bericht beachten solltest.
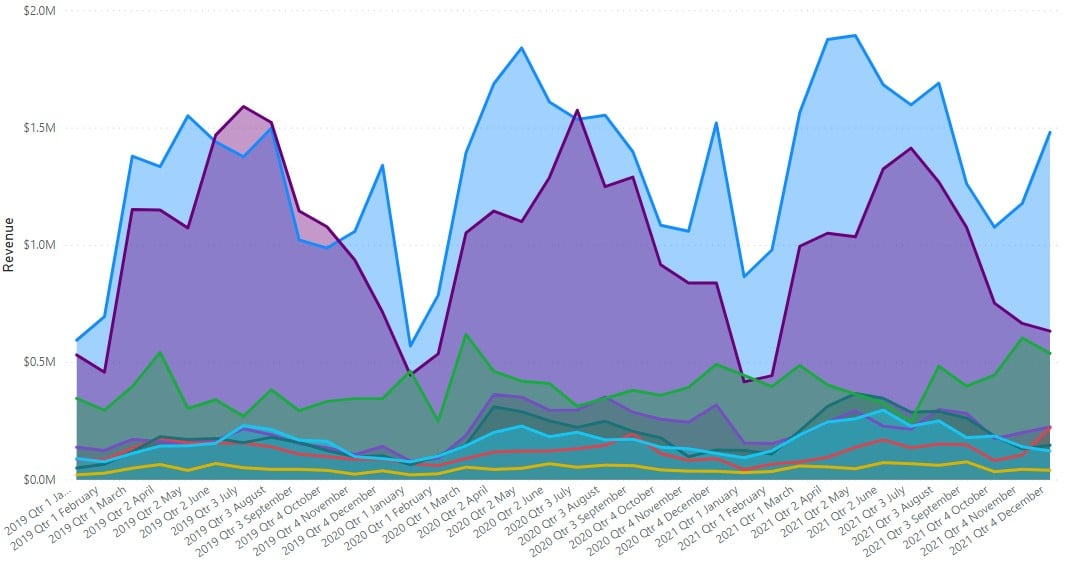
Welche Visualisierung wäre für das folgende Bild anstelle eines Flächendiagramms geeignet?
Diese Übung ist Teil des Kurses
<Kurs>Fallstudie: Wettbewerbsanalyse von Verkaufszahlen in Power BI</Kurs>Interaktive praktische Übung
Verwandle Theorie mit einer unserer interaktiven Übungen in die Praxis
 Übung starten