Calculating metrics from the confusion matrix
The confusion matrix of a binary classification model lists the number of correct and incorrect predictions obtained on the test dataset and is useful for evaluating the performance of your model.
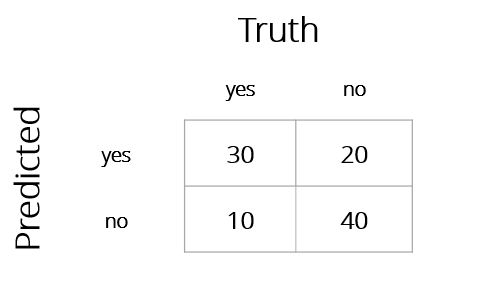
Suppose you have trained a classification model that predicts whether customers will cancel their service at a telecommunications company and obtained the following confusion matrix on your test dataset. Here yes represents the positive class, while no represents the negative class.

Choose the true statement from the options below.
This exercise is part of the course
Modeling with tidymodels in R
Hands-on interactive exercise
Turn theory into action with one of our interactive exercises
 Start Exercise