The efficient frontier
One of the ways to construct the efficient frontier of risk vs return given a set of assets is to randomly generate combinations and plot the characteristics of each portfolio. In this plot, the x-axis is the risk (standard deviation) and the y-axis is the expected return of each portfolio.
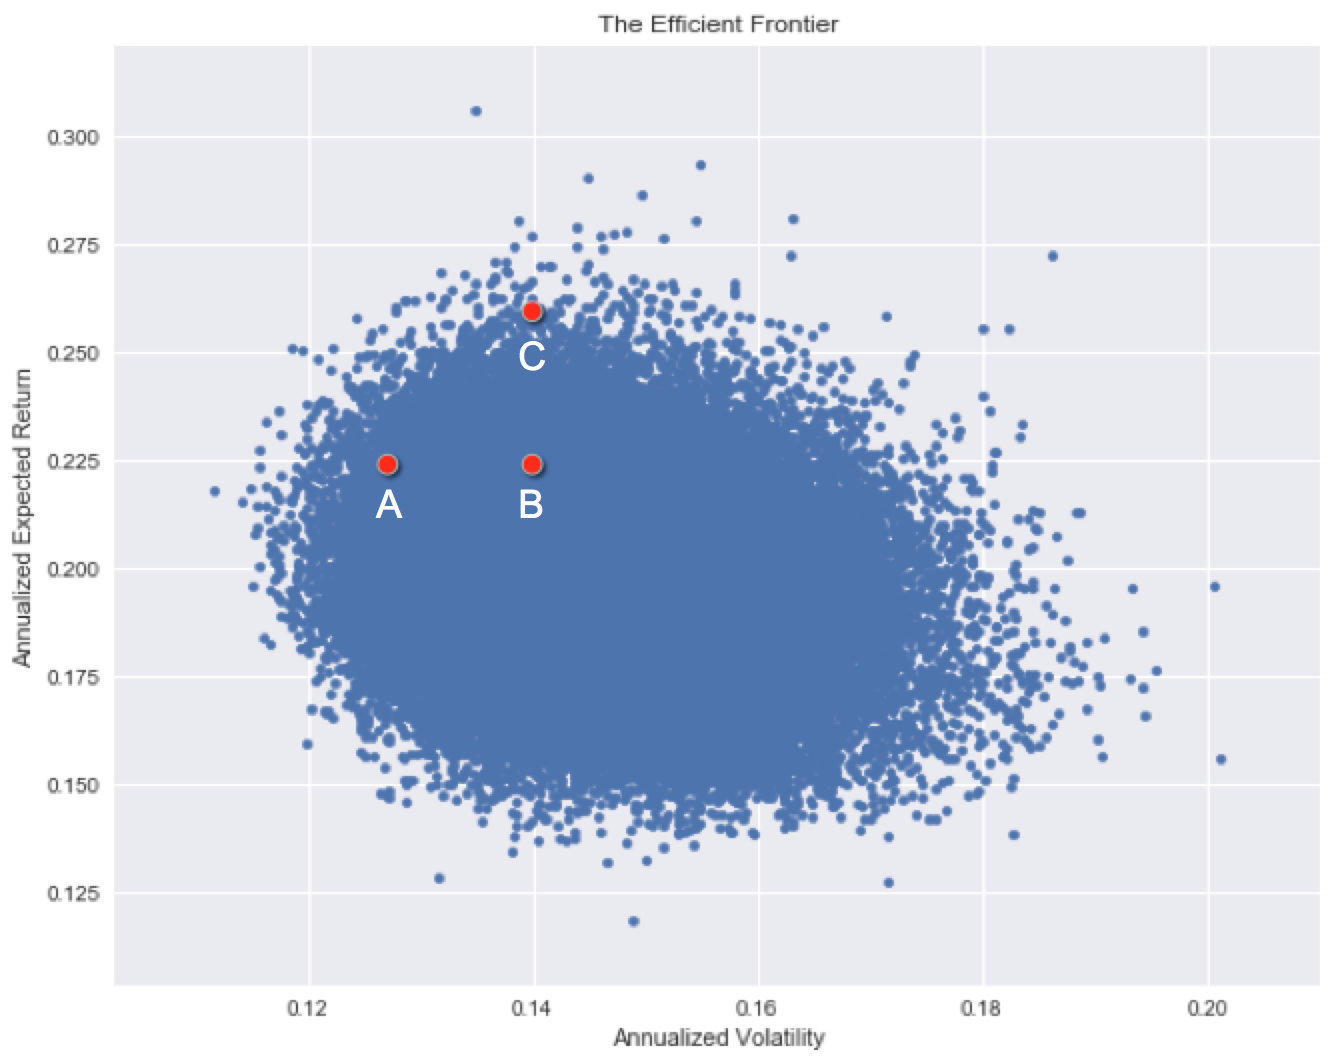
Each investment has a historical risk level and a historical return. Note how some assets are more superior than others historically, but some are hard to choose between.
Which investment has the best historical risk / return characteristics?
This exercise is part of the course
Introduction to Portfolio Risk Management in Python
Hands-on interactive exercise
Turn theory into action with one of our interactive exercises
 Start Exercise