Logistic regression algorithm
Let's dig into the internals and implement a logistic regression algorithm. Since R's glm() function is very complex, you'll stick to implementing simple logistic regression for a single dataset.
Rather than using sum of squares as the metric, we want to use likelihood. However, log-likelihood is more computationally stable, so we'll use that instead. Actually, there is one more change: since we want to maximize log-likelihood, but optim() defaults to finding minimum values, it is easier to calculate the negative log-likelihood.
The log-likelihood value for each observation is
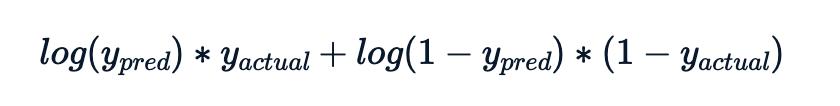
The metric to calculate is minus the sum of these log-likelihood contributions.
The explanatory values (the time_since_last_purchase column of churn) are available as x_actual.
The response values (the has_churned column of churn) are available as y_actual.
This exercise is part of the course
Intermediate Regression in R
Hands-on interactive exercise
Have a go at this exercise by completing this sample code.
# Set the intercept to 1
intercept <- ___

# Set the slope to 0.5
slope <- ___

# Calculate the predicted y values
y_pred <- ___

# Calculate the log-likelihood for each term
log_likelihoods <- ___

# Calculate minus the sum of the log-likelihoods for each term
___