Histograms
In this exercise, you will analyze the amount of red in the image. To do this, the histogram of the red channel will be computed for the image shown below:
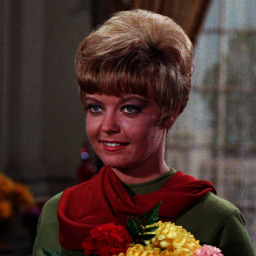
Image loaded as
image.
Extracting information from images is a fundamental part of image enhancement. This way you can balance the red and blue to make the image look colder or warmer.
You will use hist() to display the 256 different intensities of the red color. And ravel() to make these color values an array of one flat dimension.
Matplotlib is preloaded as plt and Numpy as np.
Remember that if we want to obtain the green color of an image we would do the following:
green = image[:, :, 1]
This exercise is part of the course
Image Processing in Python
Exercise instructions
- Obtain the red channel using slicing.
- Plot the histogram and bins in a range of 256. Don't forget
.ravel()for the color channel.
Hands-on interactive exercise
Have a go at this exercise by completing this sample code.
# Obtain the red channel
red_channel = image[____, ____, ____]

# Plot the red histogram with bins in a range of 256
plt.____(____.____, bins=____)

# Set title and show
plt.title('Red Histogram')
plt.show()