Layers of a leaflet map
As you saw earlier, leaflet maps are created in layers, not unlike a ggplot plot. The sequence of layers placed is important, since each new layer is stacked on top of existing ones.
In this exercise, you will need to complete the code below to produce the map seen in the picture.
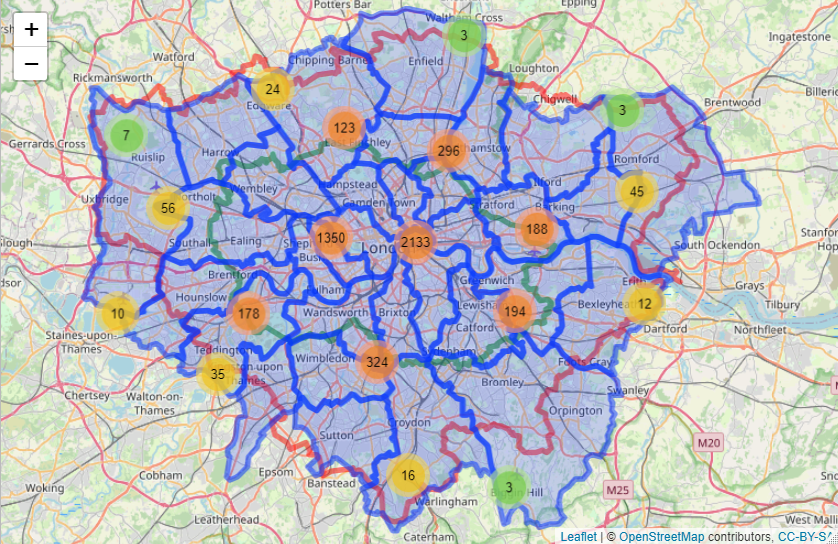
There are four sf objects stored here as:
london_polylondon_looplondon_capitallistings_geo
The sf and tidyverse libraries have been loaded.
This exercise is part of the course
Building Dashboards with shinydashboard
Exercise instructions
- Import the leaflet library.
- Use the default map provider in this map.
- Add two polylines, one for
loop_geoand one forcapital_geo. - Add regular markers with clustered points, so that sf objects of type
POINTare grouped together on the rendered map.
Hands-on interactive exercise
Have a go at this exercise by completing this sample code.
# Import the leaflet library
____
loop_geo <- london_loop$geometry[[1]]; capital_geo <- london_capital$geometry[[1]]
leaflet(london_poly) %>%
  # Use the default map provider
  ____ %>%
  # Add two polylines
  ____(loop_geo[,1], loop_geo[,2],
               color = "red") %>%
  ____(____,
               color = "green") %>%
  # Add regular markers with clustered points
  ____(data = listings_geo,
             ____) %>%
  addPolygons(label=~Name)