How many home runs?
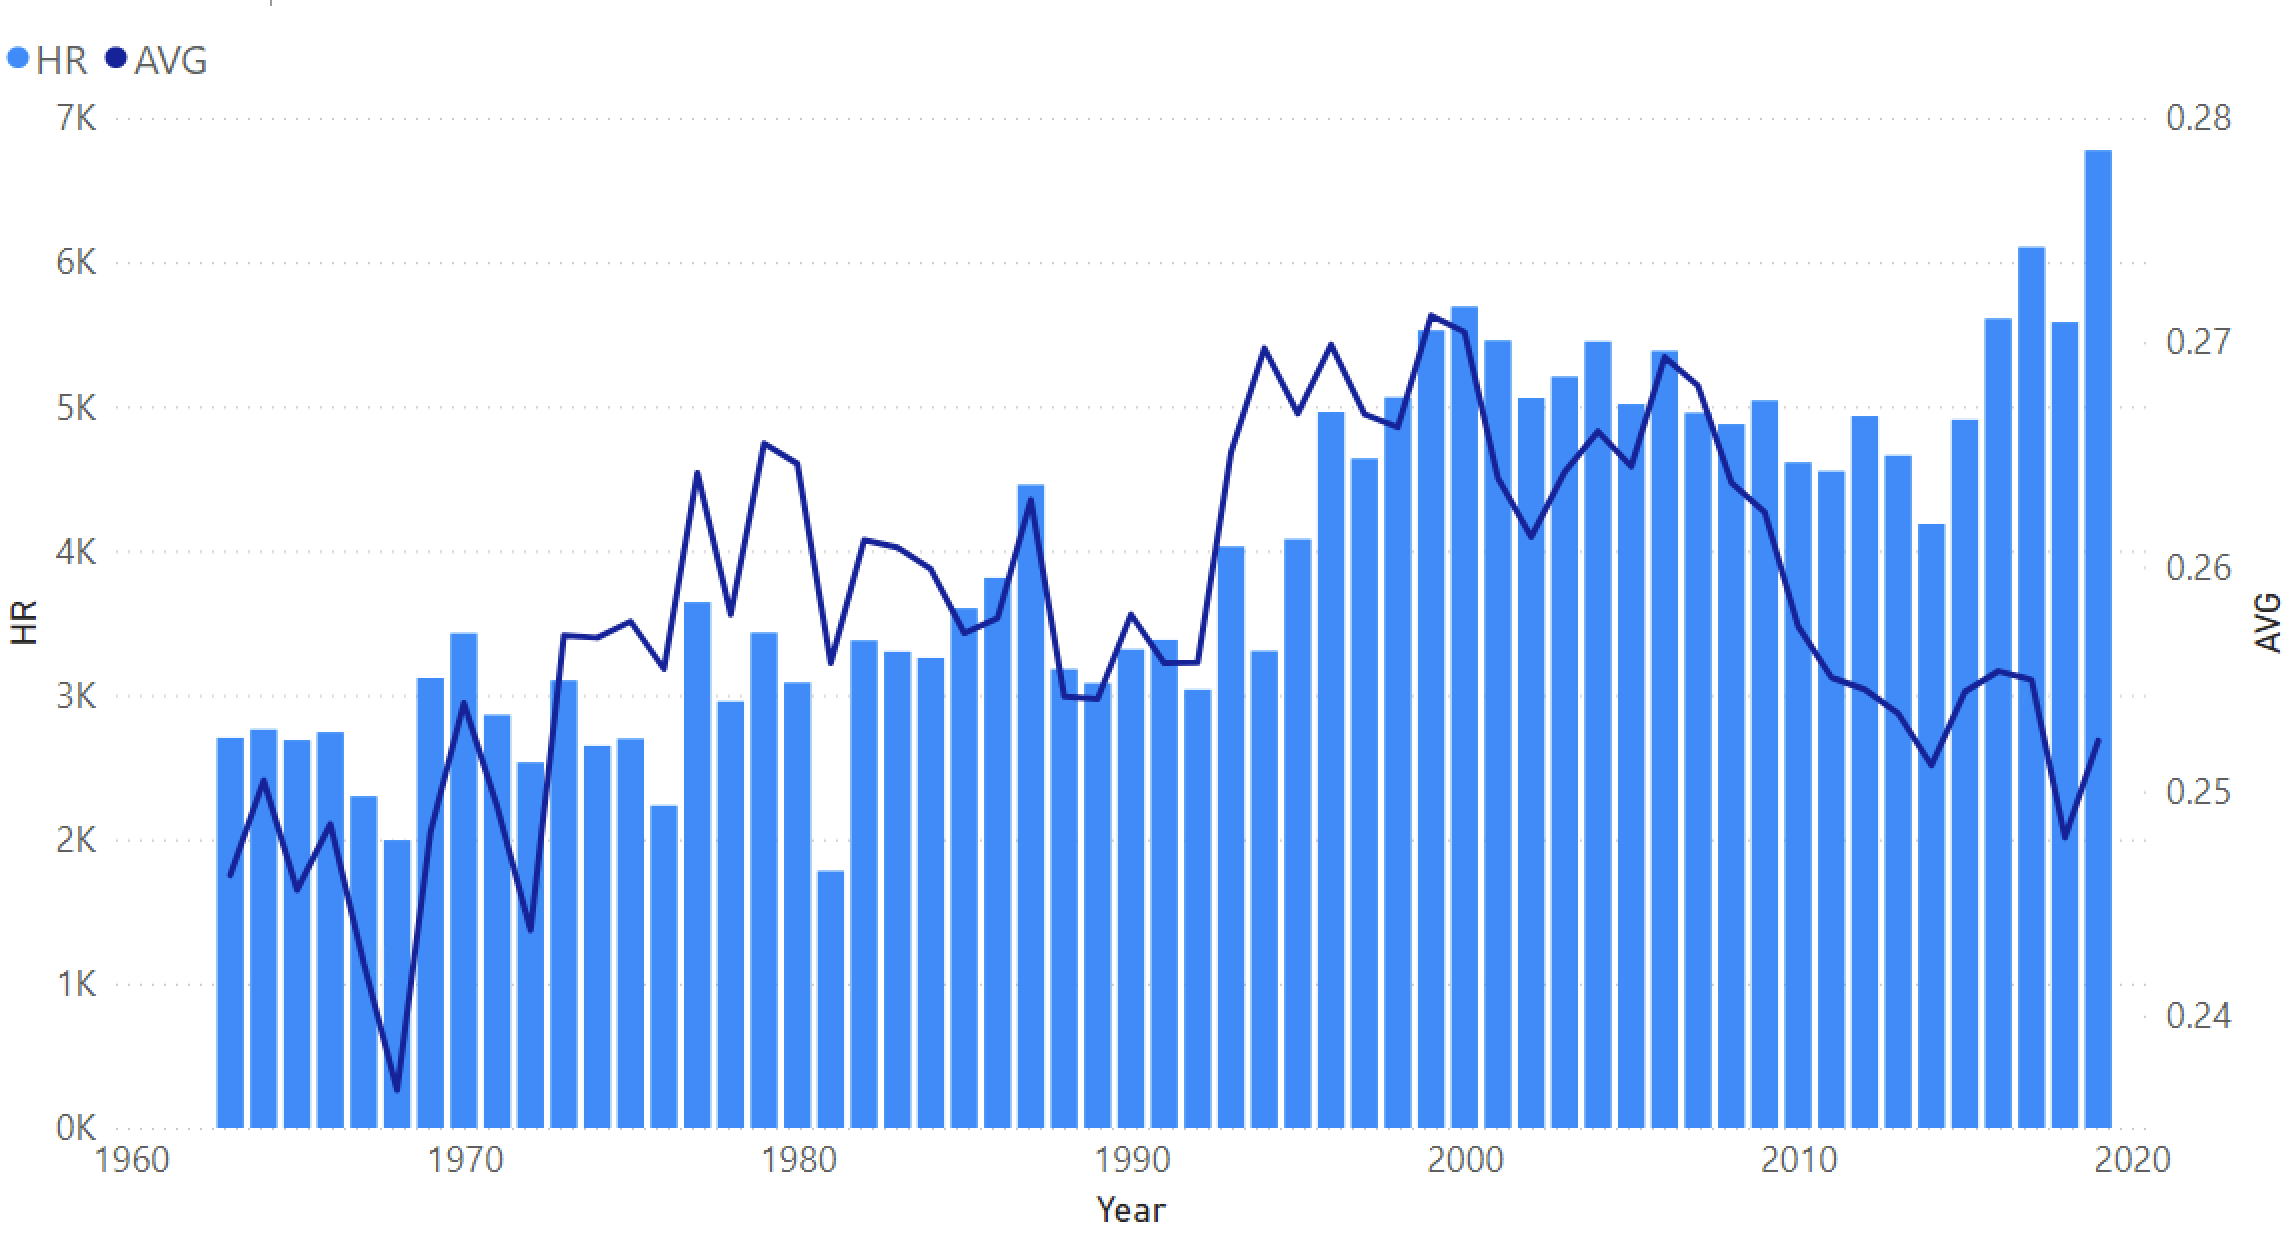 Considering the line and clustered column chart visual you created in the previous exercise, which year during the period 1963 to 2019 had the fewest number of home runs (HR)?
This exercise is part of the course
Baseball Data Visualization in Power BI
Hands-on interactive exercise
Turn theory into action with one of our interactive exercises
 Start Exercise