Interpreting correlation heatmaps
If you want to find the relationship between many pairs of numeric variables, you can use a close relative of the pair plot, namely the correlation heatmap. It takes the correlation scores you saw from the pair plot, but rather than giving you lots of numbers to look at, it displays them using colors. A great use case for this is finding related products.
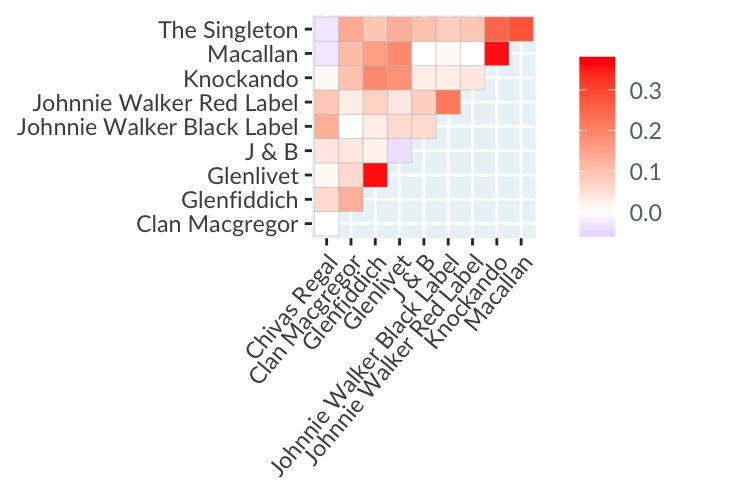
Here's a dataset from a survey on scotch whisky consumption. In the correlation heatmap, each row and column shows a brand of scotch, and cells show that correlation between drinking one brand and drinking another within the past twelve months.
Data source: Bayesian Statistics & Marketing
This exercise is part of the course
Understanding Data Visualization
Hands-on interactive exercise
Turn theory into action with one of our interactive exercises
 Start Exercise