Exploring the traffic sign dataset
To better understand how the knn() function was able to classify the stop sign, it may help to examine the training dataset it used.
Each previously observed street sign was divided into a 4x4 grid, and the red, green, and blue level for each of the 16 center pixels is recorded as illustrated here.
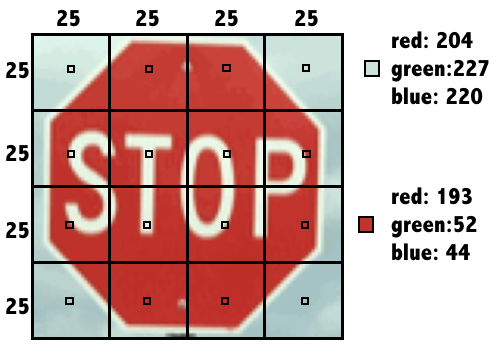
The result is a dataset that records the sign_type as well as 16 x 3 = 48 color properties of each sign.
This exercise is part of the course
Supervised Learning in R: Classification
Exercise instructions
- Use the
str()function to examine thesignsdataset. - Use
table()to count the number of observations of each sign type by passing it the column containing the labels. - Run the provided
aggregate()command to see whether the average red level might vary by sign type.
Hands-on interactive exercise
Have a go at this exercise by completing this sample code.
# Examine the structure of the signs dataset


# Count the number of signs of each type
table(___)

# Check r10's average red level by sign type
aggregate(r10 ~ sign_type, data = signs, mean)