Relational Neighbor Classifier
In this exercise, you will apply a simple network based classifier called the relational neighbor classifier.
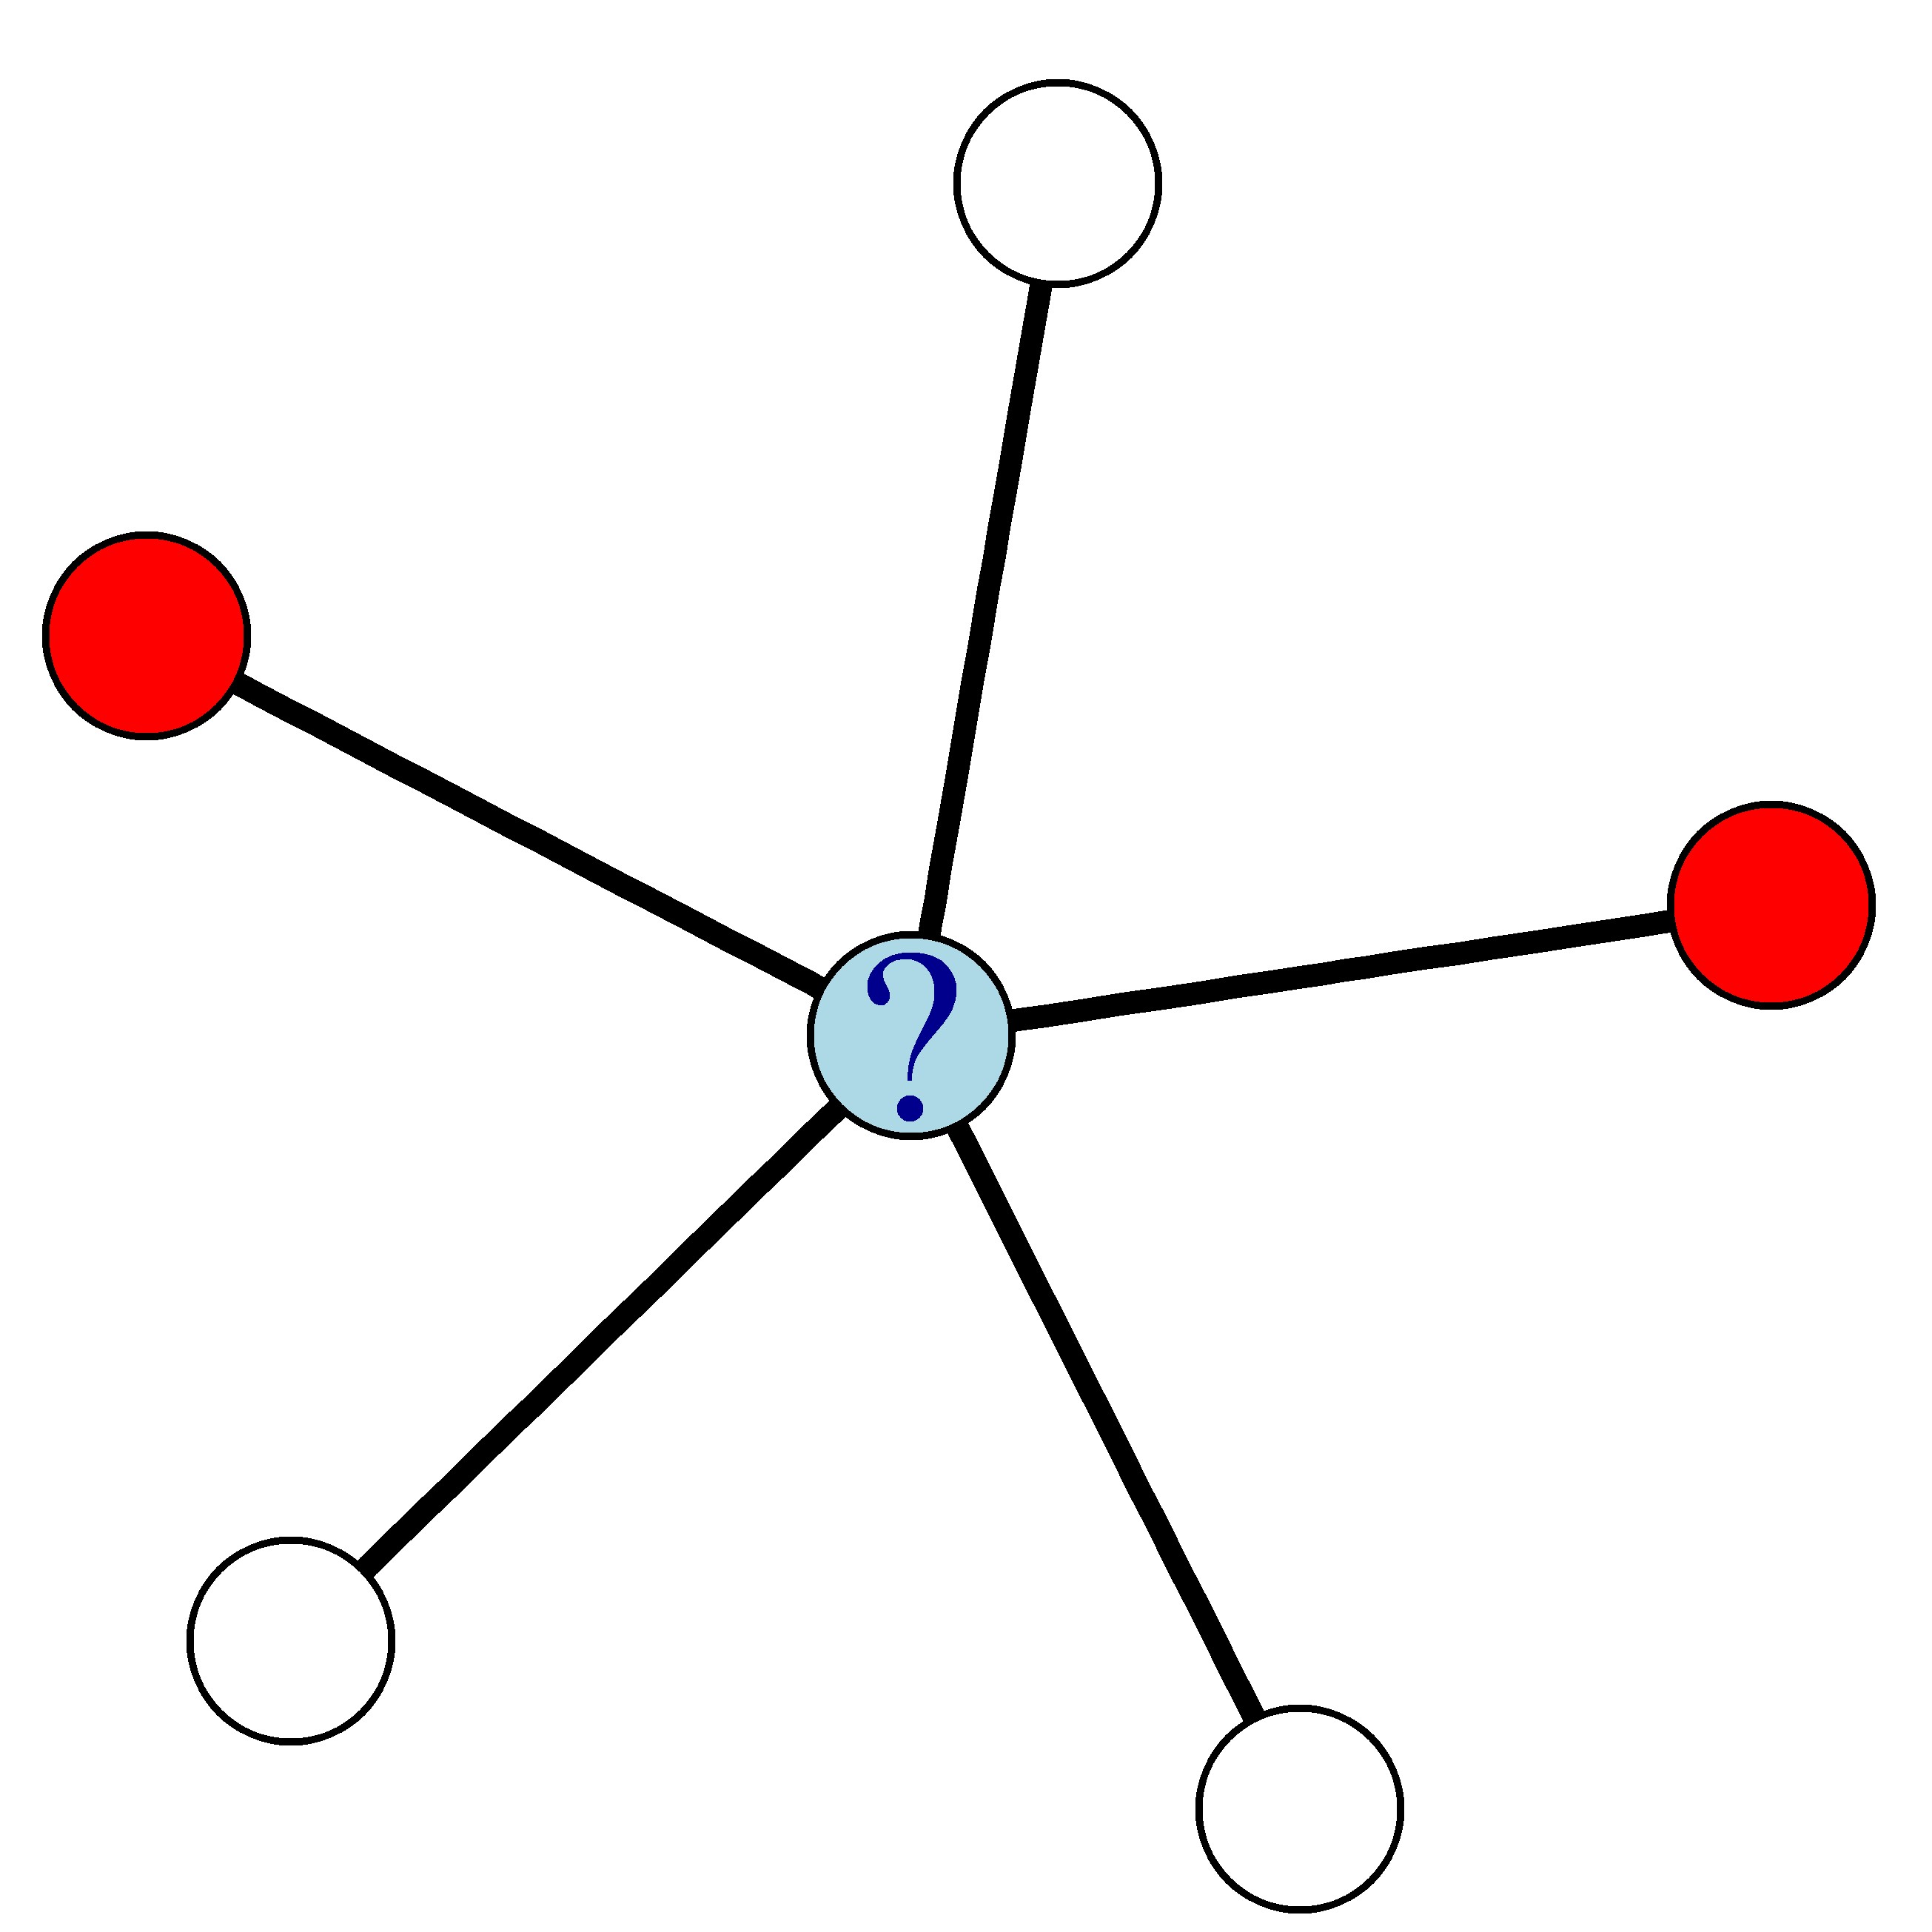
It uses the class labels of neighboring nodes to compute a churn probability for each node in the network.
For example, in the network below where red nodes denote churners and white nodes denote non-churners, the churn probability of the blue node is 0.4.
You are given two vectors: ChurnNeighbors and NonChurnNeighbors with each customer's number of neighbors that have churned and not churned, respectively.
This exercise is part of the course
Predictive Analytics using Networked Data in R
Exercise instructions
- Compute the churn probability of each customer,
churnProb, using the relational neighbor classifier. - Use
which()to find the customers with the highest probability of churning. Call this vectormostLikelyChurners. - Use
mostLikelyChurnersto find the IDs of the customers with the highest churn probability.
Hands-on interactive exercise
Have a go at this exercise by completing this sample code.
# Compute the churn probabilities
churnProb <- ___ / (ChurnNeighbors + ___)

# Find who is most likely to churn
mostLikelyChurners <- which(churnProb == ___(churnProb))

# Extract the IDs of the most likely churners
customers$id[___]