Extracting types of edges
In this exercise, you will match the customer IDs in the customer dataframe with the customer edgelist to find out whether each edge is a churn, non-churn or a mixed edge.
Using the function match(), you will add two columns to the edgelist.
fromLabelwith the churn status of thefromcolumntoLabelwith the churn status of thetocolumn
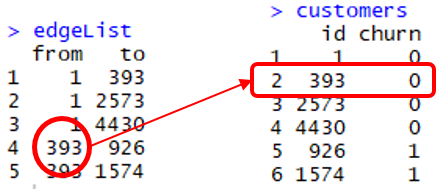
The command match(x, y) returns a vector with the location of x in y. In the figure above match(edgeList$from, customers$id) is 1,1,1,2,2. For example, the fourth line in edgeList$from, which is customer with id 393, is the second element in customers$id.
The churn label of this customer is, therefore, customers[2,2] or 0.
Similarly, the churn label of everyone in edgeList$from is customers[match(edgeList$from, customers$id),2].
This exercise is part of the course
Predictive Analytics using Networked Data in R
Exercise instructions
- Add a column called
FromLabelto theedgeListdataframe with the label of thefromnodes by matchingcustomers$idwithedgeList$fromand extractingcustomers$churn. - Do the same for the
toedges, and call this columnToLabel. - Add a column called
edgeTypeto theedgeListdataframe that is the sum of the columnsFromLabelandToLabel. - Use the
table()function to see the number of each type of edge.
Hands-on interactive exercise
Have a go at this exercise by completing this sample code.
# Add the column edgeList$FromLabel
edgeList$FromLabel <- customers[match(edgeList$___, customers$___), 2]

# Add the column edgeList$ToLabel
edgeList$ToLabel <- customers[___(___, ___), 2]

# Add the column edgeList$edgeType
edgeList$edgeType <- edgeList$___ + edgeList$___

# Count the number of each type of edge
___(edgeList$edgeType)