Outlier detection
A very important aspect of preprocessing your data correctly is outlier detection. In machine learning interview questions, a common question is how to locate and process outliers. An easy way to detect outliers is by visualizing them graphically.
After finding and imputing missing data, finding and figuring out what to do about outliers is another necessary preprocessing step.
There's a variety of packages that let you visualize outliers, but in this exercise, you will be using seaborn to plot univariate and multivariate boxplots of selected columns of loan_data.
All relevant packages have been imported for you.
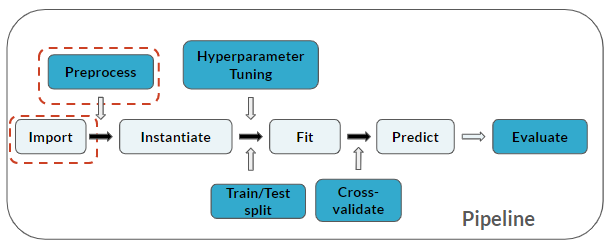
Where are you with the pipeline?
This exercise is part of the course
Practicing Machine Learning Interview Questions in Python
Hands-on interactive exercise
Have a go at this exercise by completing this sample code.
# Import modules
import matplotlib.pyplot as plt
import seaborn as sns

# Univariate and multivariate boxplots
fig, ax =plt.subplots(1,2)
sns.____(y=____['_____'], ax=ax[0])
sns.____(x='Loan Status', y='Annual Income', data=____, ax=ax[1])
plt.show()