Identify the outlier
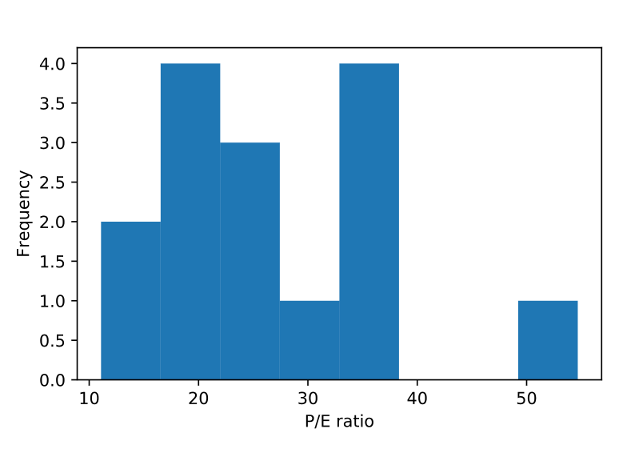
Histograms can help you to identify outliers or abnormal data points. Which P/E ratio in this histogram is an example of an outlier?
This exercise is part of the course
Introduction to Python for Finance
Hands-on interactive exercise
Turn theory into action with one of our interactive exercises
 Start Exercise