Computing expected number of counts
In the previous exercises you have computed the mean and variance of the crab data and you determined they are not equal. In this exercise you will practice another analysis for overdispersion by using the already computed mean and calculating the expected number of counts per certain value of counts, for example zero counts. In other words, what count of zero satellites should we expect in the sample given the computed sample mean.
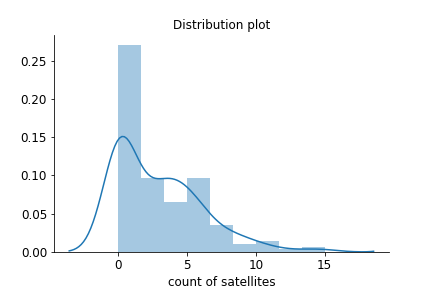
Recall figure from the crab dataset where you can notice a large number of zero counts.
Recall that to compute the expected number of counts given the parameter you can use the defined Poisson distribution, given by
$$ P(y)=\frac{\lambda^ye^{-\lambda}}{y!} $$
The crab dataset and the computed mean sat_mean is preloaded in the workspace.
This exercise is part of the course
Generalized Linear Models in Python
Exercise instructions
- Using computed mean
sat_meanand the zero counts \(y = 0\) compute the expected number of zero counts. Usemathfactorial(). - Compute the number of observations with zero counts in the
satvariable using thesum()and the total number of observations in the sample using thelen()functions. - Print the ratio of actual zero count observations and total number of observations.
Hands-on interactive exercise
Have a go at this exercise by completing this sample code.
# Expected number of zero counts
exp_zero_cnt = ((____**____)*np.____(-____))/math.____(____)

# Print exp_zero_counts
print('Expected zero counts given mean of ', round(____,3),
      'is ', round(____,3)*100)

# Number of zero counts in sat variable
actual_zero_cnt = sum(____[____]  == 0)

# Number of observations in crab dataset
num_obs = len(____)

# Print the percentage of zero count observations in the sample
print('Actual zero counts in the sample: ', round(____ / ____,3)*100)