Basic A/B test
Now that we know the sample size required, and we allowed the experiment to run long enough to get at least 400 people in each group, we can analyze our A/B test.
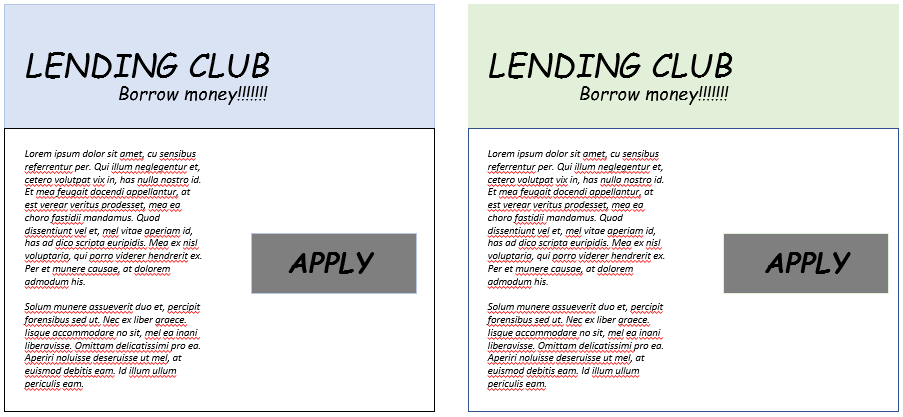
Remember that when applicants were using the Lending Club website, they were randomly assigned to two groups, A or B, where A was shown a mint green website header and B was shown a light blue website header. Lending Club was interested to see if website header color choice influenced loan_amnt, the amount an applicant asked to borrow.
A new dataset, lendingclub_ab is available in your workspace. The A/B test was run until there were 500 applicants in each group. Each applicant has been labeled as group A or B. Conduct the proper test to see if the mean of loan_amnt is different between the two groups.
This exercise is part of the course
Experimental Design in R
Exercise instructions
- Create a boxplot of
loan_amntbyGroupusingggplot2. - Conduct the two-sided t-test to test the A/B test results.
Hands-on interactive exercise
Have a go at this exercise by completing this sample code.
# Plot the A/B test results
ggplot(___, aes(x = ___, y = ___)) +
	geom_boxplot()

# Conduct a two-sided t-test
t.test(___ ~ ___, data = ___)