App 2: Popular Baby Names
Building a Shiny app is a modular process. You start with the UI, then you work on the server code, building outputs based on the user inputs. The more you practice this approach deliberately, the easier it will become to build good apps.
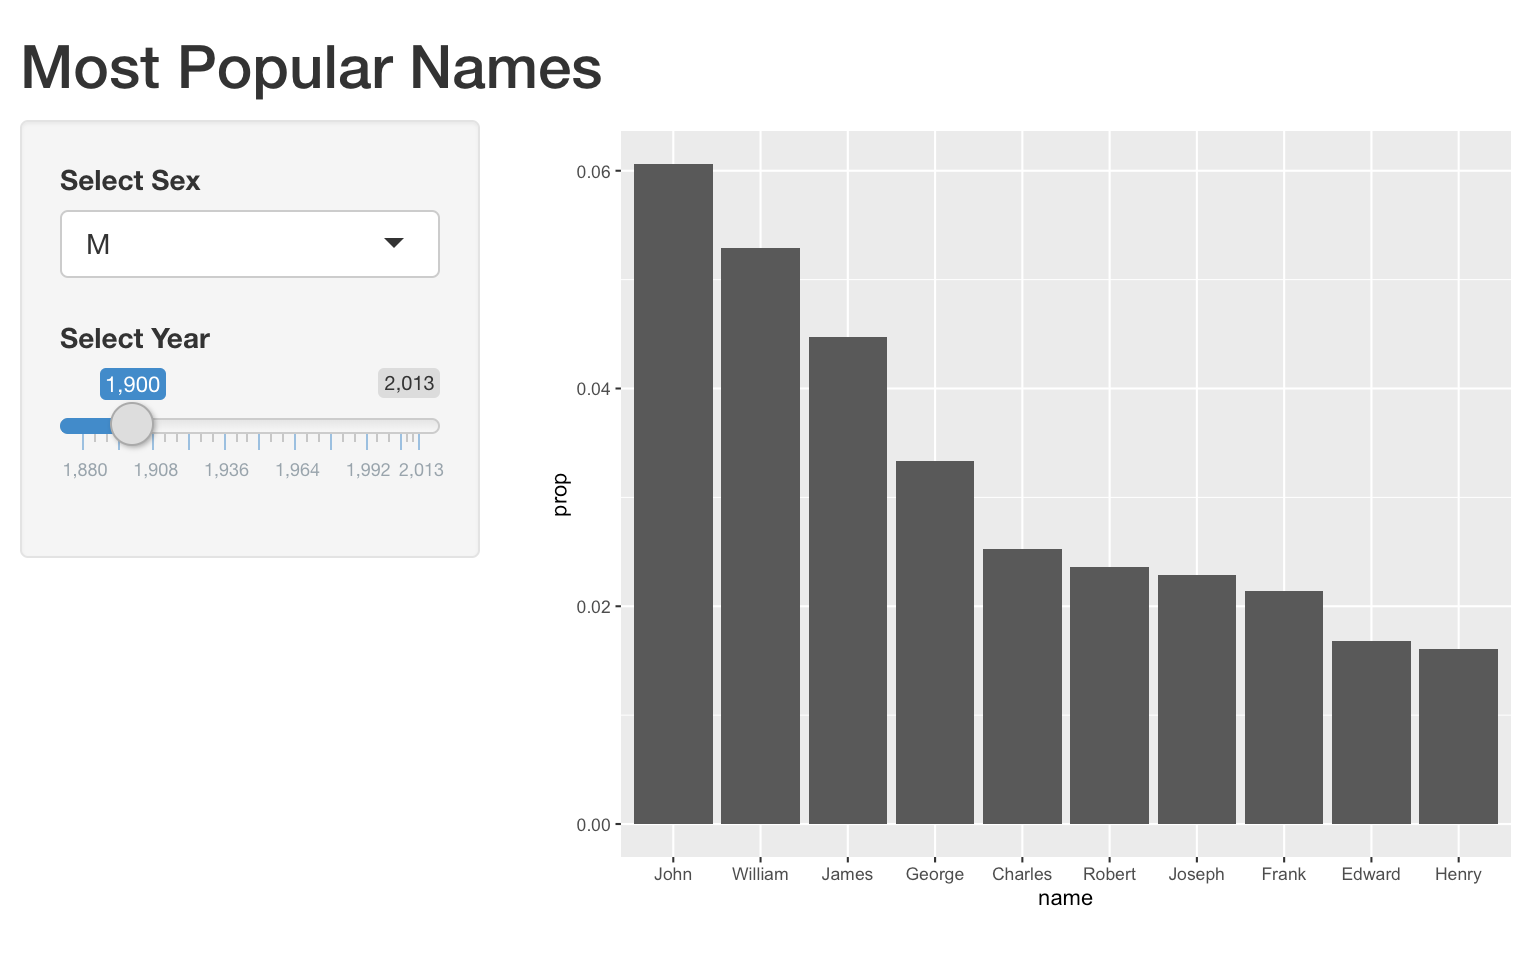
You will now build a Shiny app that lets a user choose sex and year, and will
display the top 10 most popular names in that year as a column plot of
proportion of births (prop) by name (name). Your final app should visually
resemble the screenshot below.
We have provided a function get_top_names() to extract the top 10 names for a
given year and sex. For example, you can get the top 10 male names for the
year 2000 using get_top_names(2000, "M").
We have also loaded the ggplot2 package. You can create a column plot from a
data frame d with columns x and y using:
ggplot(d, aes(x = x, y = y)) +
  geom_col()
This exercise is part of the course
Building Web Applications with Shiny in R
Exercise instructions
- Add a title to the top of your app and add a sidebar layout.
- Add an input to the sidebar to let the user select sex (
MorF). - Add a slider to the sidebar to let the user select a year (1880 to 2017).
- Add a plot output to the main panel.
- Add an output to the server to render a column plot based on
yearandsex. Note that you can add multiple lines of code inside the curly braces of a rendering function function:render***({___}).
Hands-on interactive exercise
Have a go at this exercise by completing this sample code.
ui <- fluidPage(

)

server <- function(input, output, session) {

}

shinyApp(ui = ui, server = server)