Explore the Mental Health in Tech 2014 Survey
Don't be intimidated, but in this exercise, you're going to build the entirety of this app (minus the custom error message) in one go!
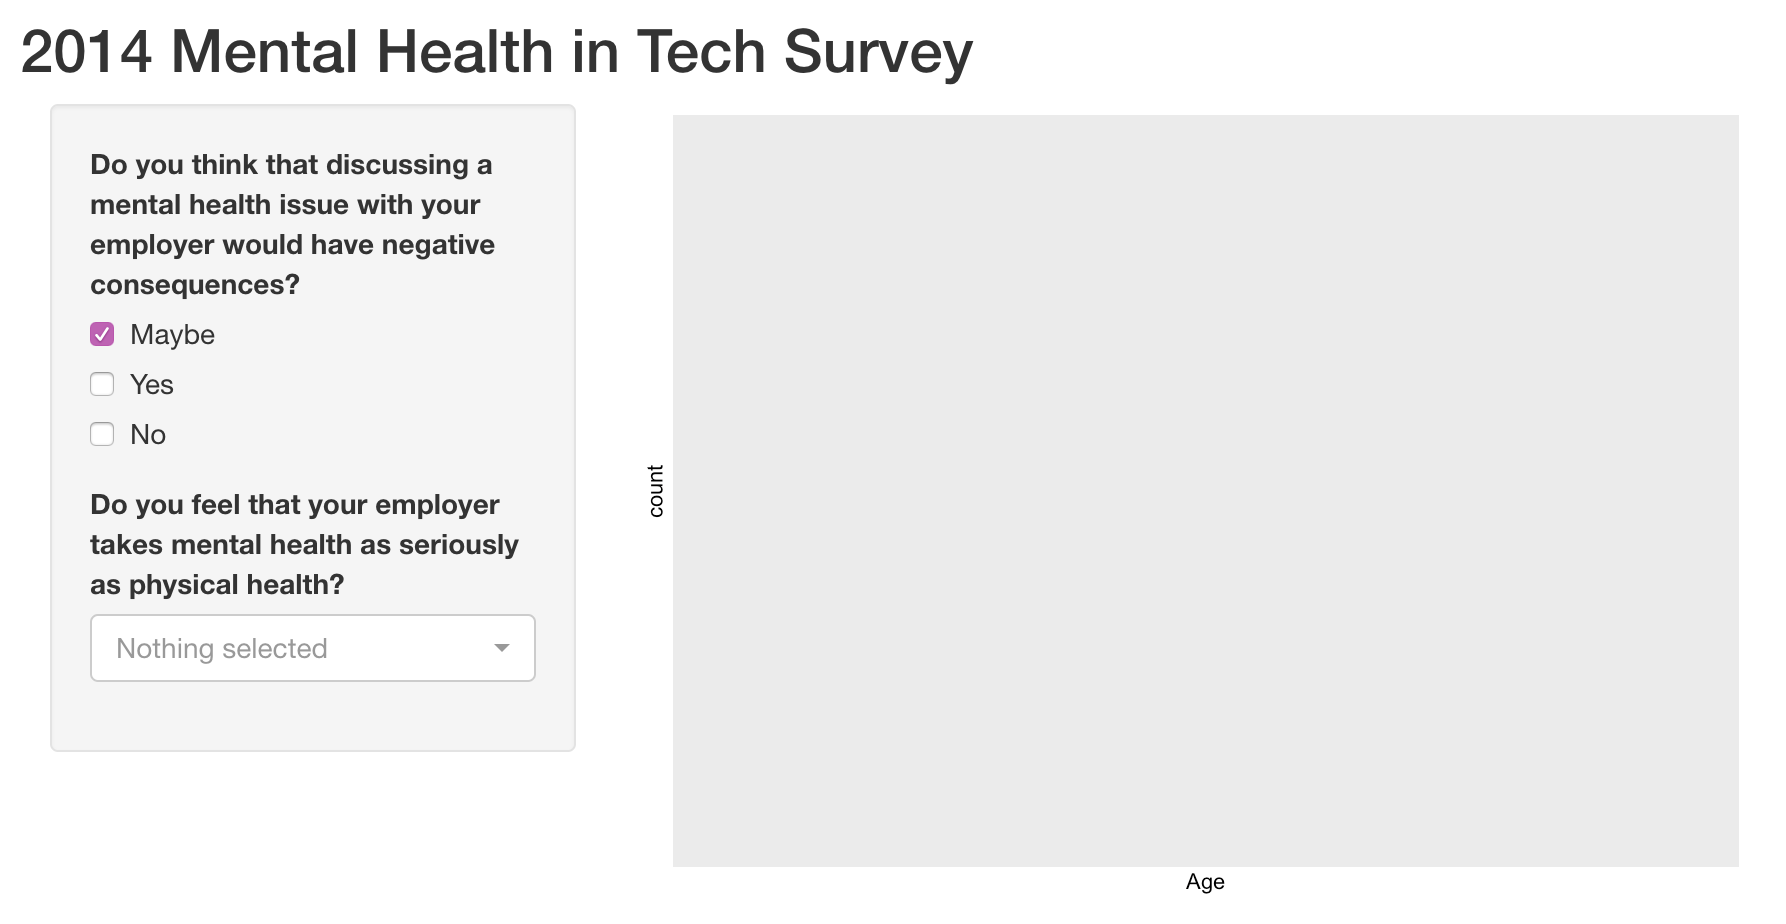
For this app, you'll be using the questions "Do you think that discussing a mental health issue with your employer would have negative consequences?" (the mental_health_consequence variable) and "Do you feel that your employer takes mental health as seriously as physical health?" (mental_vs_physical) as multi-selector inputs, then displaying a histogram of the Age of respondents. To see the choices for these variables, count() them in the console.
Recall that when you're finished, the app will look like this (including the blank plot):
shiny, ggplot2, dplyr, and the mental_health_survey dataset have all been loaded for you.
This exercise is part of the course
Building Web Applications with Shiny in R
Exercise instructions
- UI:
- Add an appropriate title to the app.
- Add a
checkboxGroupInput(). Include a default value for theselectedargument. - Add a
pickerInput()with themultipleargument set toTRUE. - Add a
plotOutput()in the main panel.
- Server:
- Add an output that displays a histogram the
Ageof respondents, filtered by the two inputs.
- Add an output that displays a histogram the
Hands-on interactive exercise
Have a go at this exercise by completing this sample code.
ui <- fluidPage(
  # CODE BELOW: Add an appropriate title

  sidebarPanel(
  	# CODE BELOW: Add a checkboxGroupInput


  	# CODE BELOW: Add a pickerInput


  ),
  mainPanel(
	# CODE BELOW: Display the output

  )
)

server <- function(input, output, session) {
  # CODE BELOW: Build a histogram of the age of respondents
  # Filtered by the two inputs


}

shinyApp(ui, server)