Alien sightings: add inputs
The National UFO Reporting Center (NUFORC) has collected sightings data throughout the last century. This app is going to allow users to select a U.S. state and a time period in which the sightings occurred.
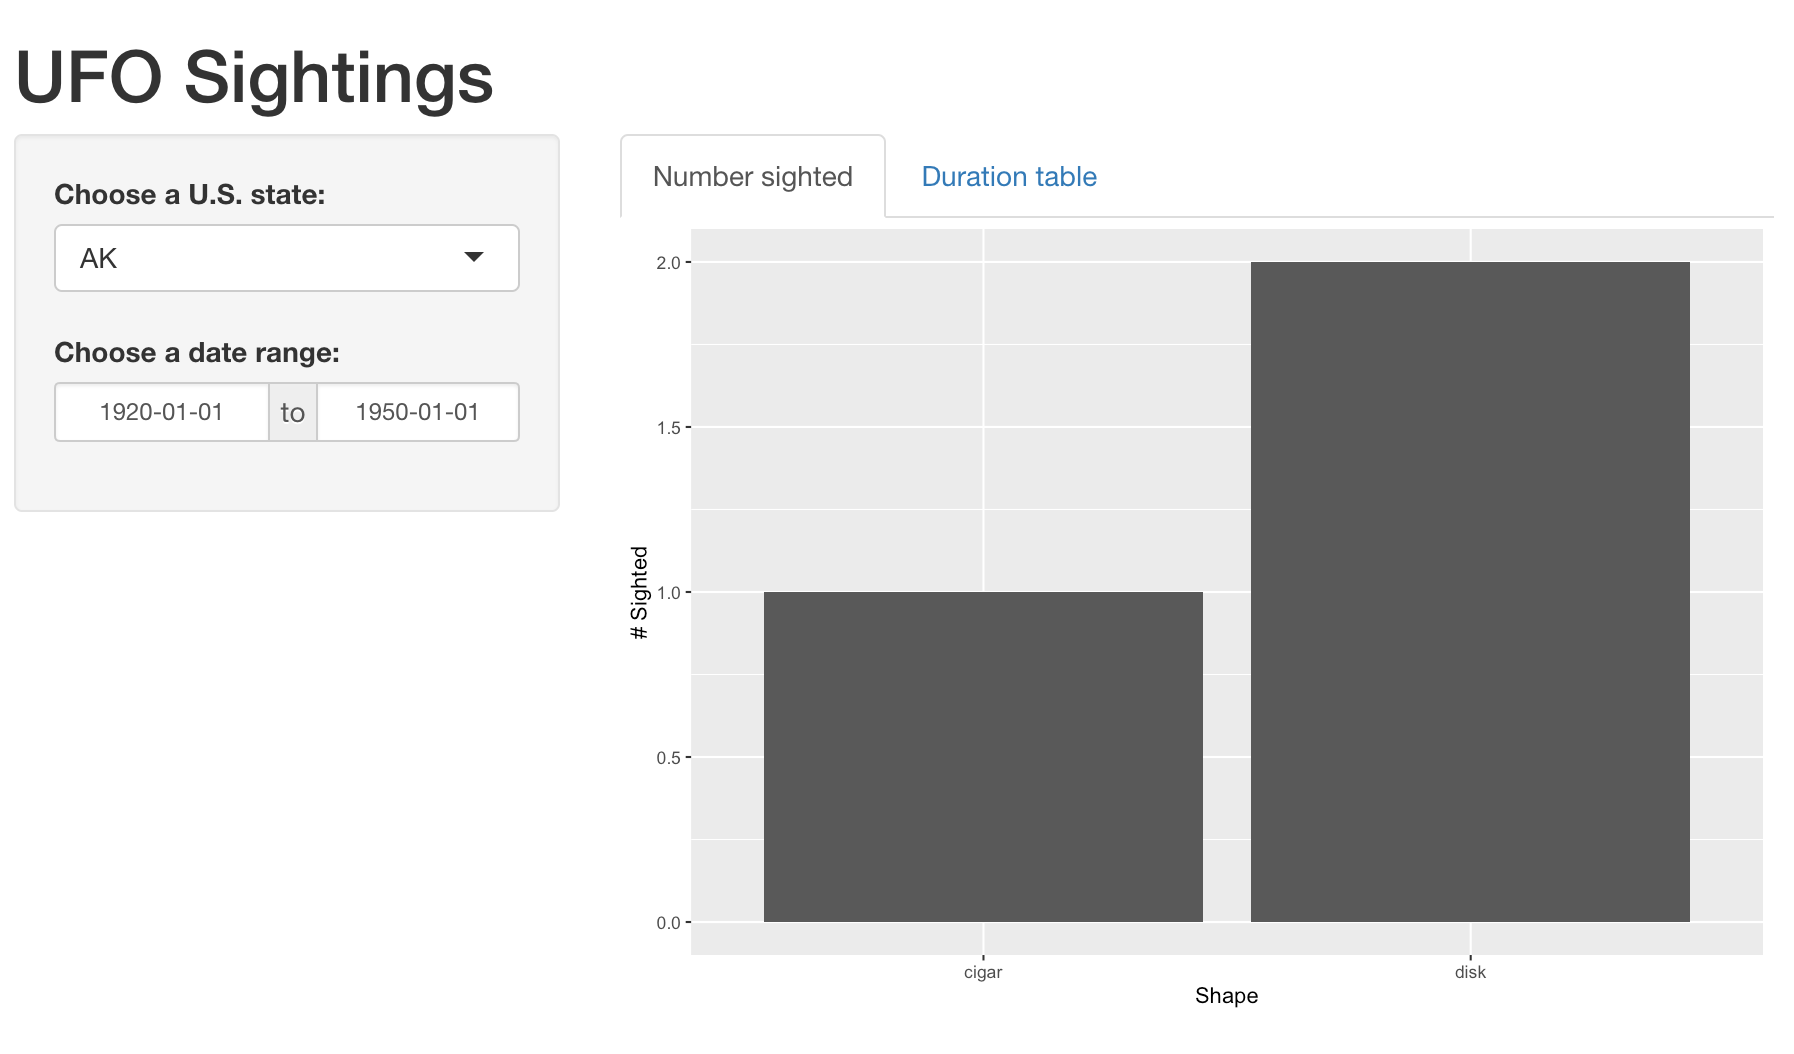
Remember that when they're added, the inputs should look as they do here, though they won't yet be in the sidebar:
The usa_ufo_sightings dataset, plus the shiny, ggplot2, and dplyr packages have all been loaded for you.
This exercise is part of the course
Building Web Applications with Shiny in R
Exercise instructions
- Add a title to your app.
- Add an input to the sidebar that allows users to select one of the 50 U.S. states.
- Add an input to the sidebar that allows users to select a range of dates. Feel free to use any
startorenddates you'd like.
Hands-on interactive exercise
Have a go at this exercise by completing this sample code.
ui <- fluidPage(
  # CODE BELOW: Add a title

  sidebarLayout(
    sidebarPanel(
      # CODE BELOW: One input to select a U.S. state
      # And one input to select a range of dates


    ),
  	mainPanel()
  )
)

server <- function(input, output) {

}

shinyApp(ui, server)