Mass shootings: modify output
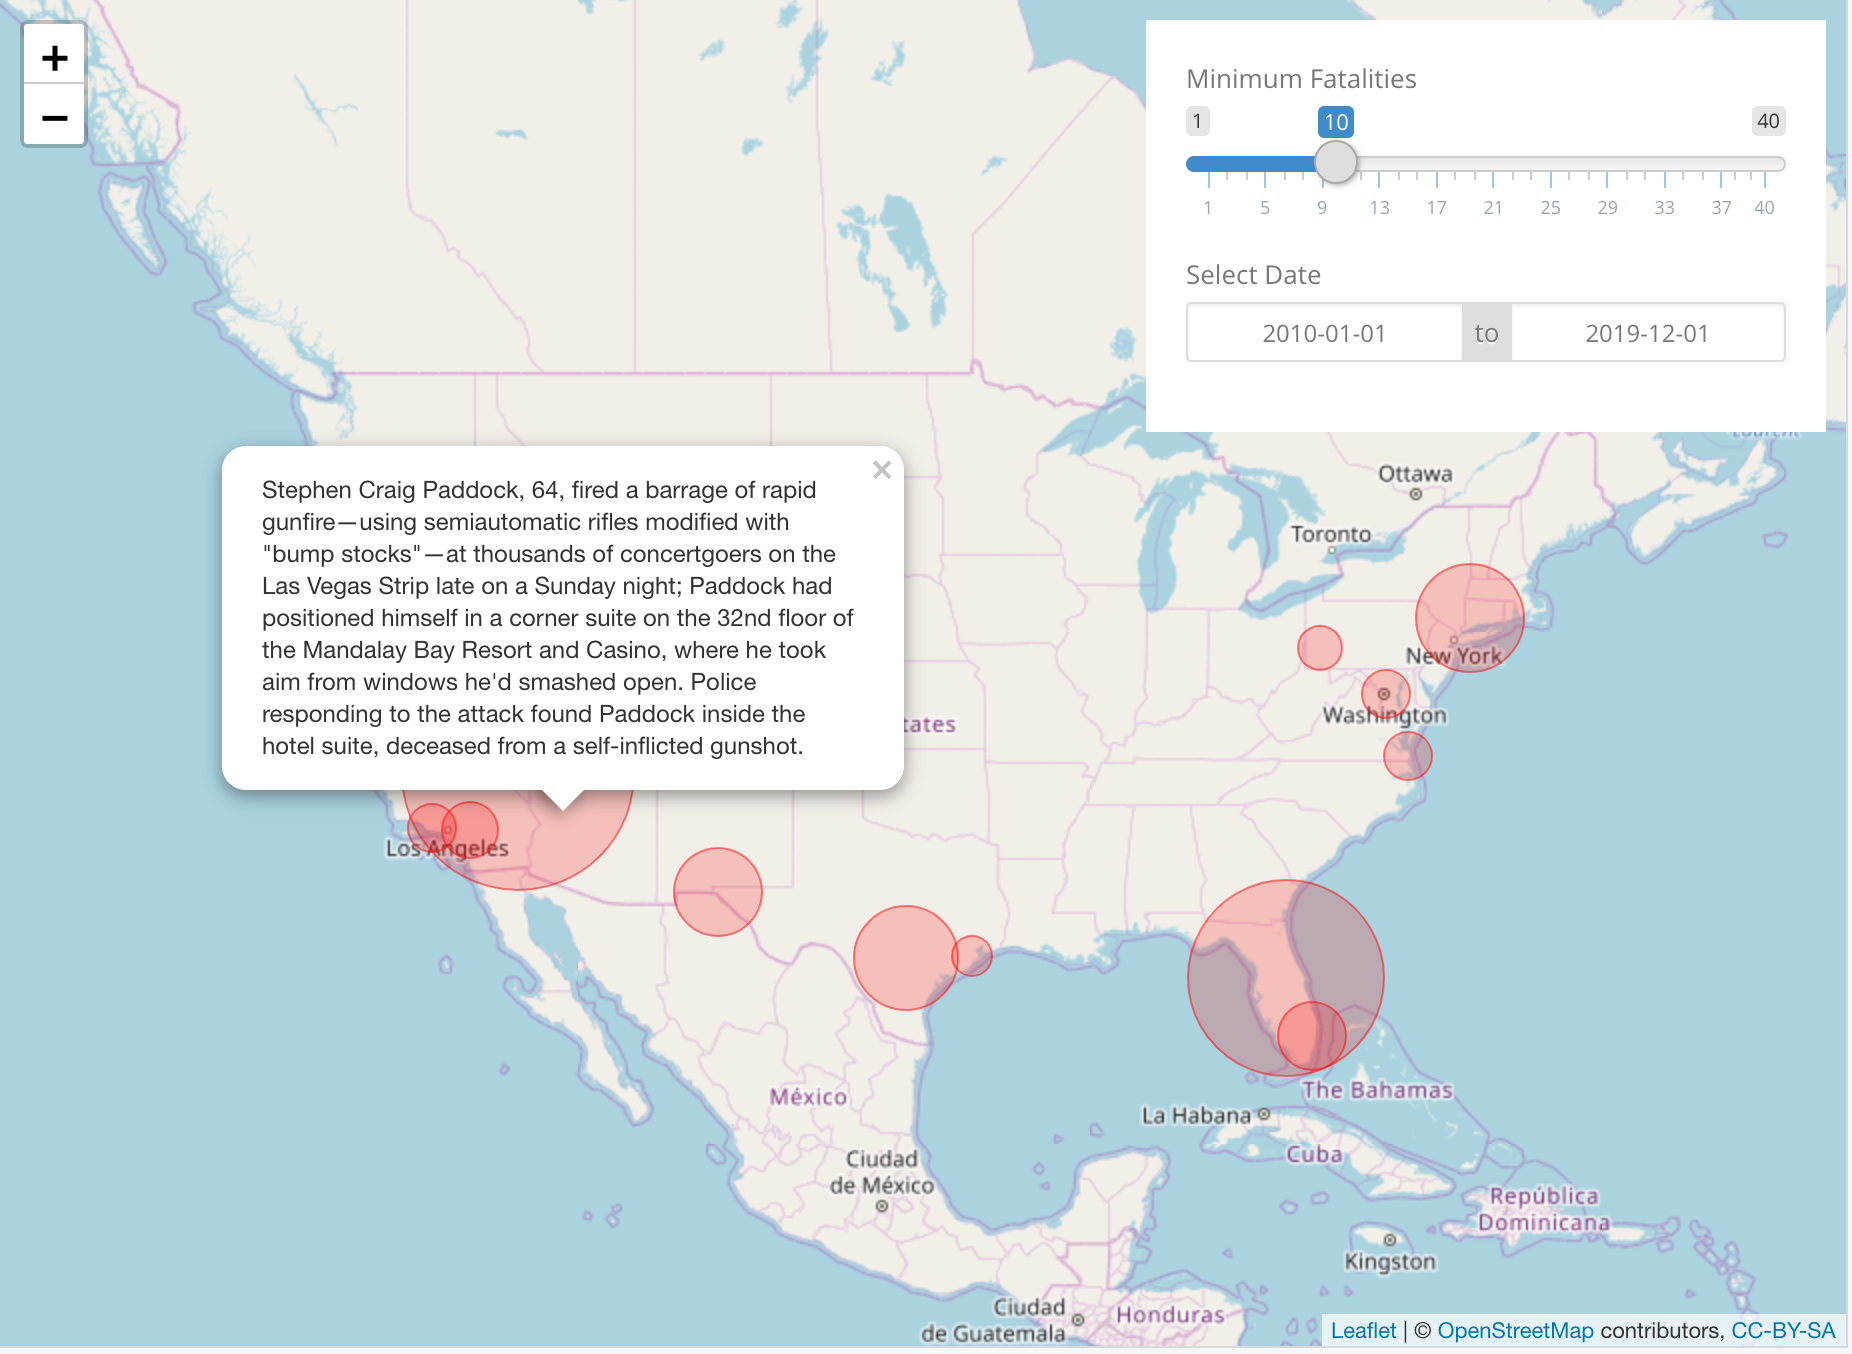
In this exercise, you will extend the Shiny app you built previously so that red circles sized based on the number of fatalities appear on the interactive map, along with a summary of the case when the circle is clicked. Your app will resemble the image in this screenshot.
This exercise is part of the course
Building Web Applications with Shiny in R
Exercise instructions
- Update the reactive expression
rval_mass_shootingsso that the dataset is filtered based on the number of fatalities (nb_fatalities) and date range (date_range) selected by the user. - Update the code inside
addCircleMarkers()so thatradiusof the circle is mapped tofatalitiesand thepopupparameter is mapped tosummary. Note that you can map a parameterpto a fieldfusingp = ~ f.
Hands-on interactive exercise
Have a go at this exercise by completing this sample code.
ui <- bootstrapPage(
  theme = shinythemes::shinytheme('simplex'),
  leaflet::leafletOutput('map', height = '100%', width = '100%'),
  absolutePanel(top = 10, right = 10, id = 'controls',
    sliderInput('nb_fatalities', 'Minimum Fatalities', 1, 40, 10),
    dateRangeInput('date_range', 'Select Date', "2010-01-01", "2019-12-01")
  ),
  tags$style(type = "text/css", "
    html, body {width:100%;height:100%}
    #controls{background-color:white;padding:20px;}
  ")
)

server <- function(input, output, session) {
  rval_mass_shootings <- reactive({
    # MODIFY CODE BELOW: Filter mass_shootings on nb_fatalities and
    # selected date_range.
    mass_shootings


  })
  output$map <- leaflet::renderLeaflet({
    rval_mass_shootings() %>%
      leaflet() %>%
      addTiles() %>%
      setView( -98.58, 39.82, zoom = 5) %>%
      addTiles() %>%
      addCircleMarkers(
        # CODE BELOW: Add parameters popup and radius and map them
        # to the summary and fatalities columns

        fillColor = 'red', color = 'red', weight = 1
      )
  })
}

shinyApp(ui, server)