Mass shootings: add inputs
Mass Shootings have been a topic of intense discussion in the United States. A public database of mass shootings since 1982 has been made available by the Mother Jones, a non-profit organization. Over the next three exercises, you will build a Shiny app to explore these shootings on an interactive map.
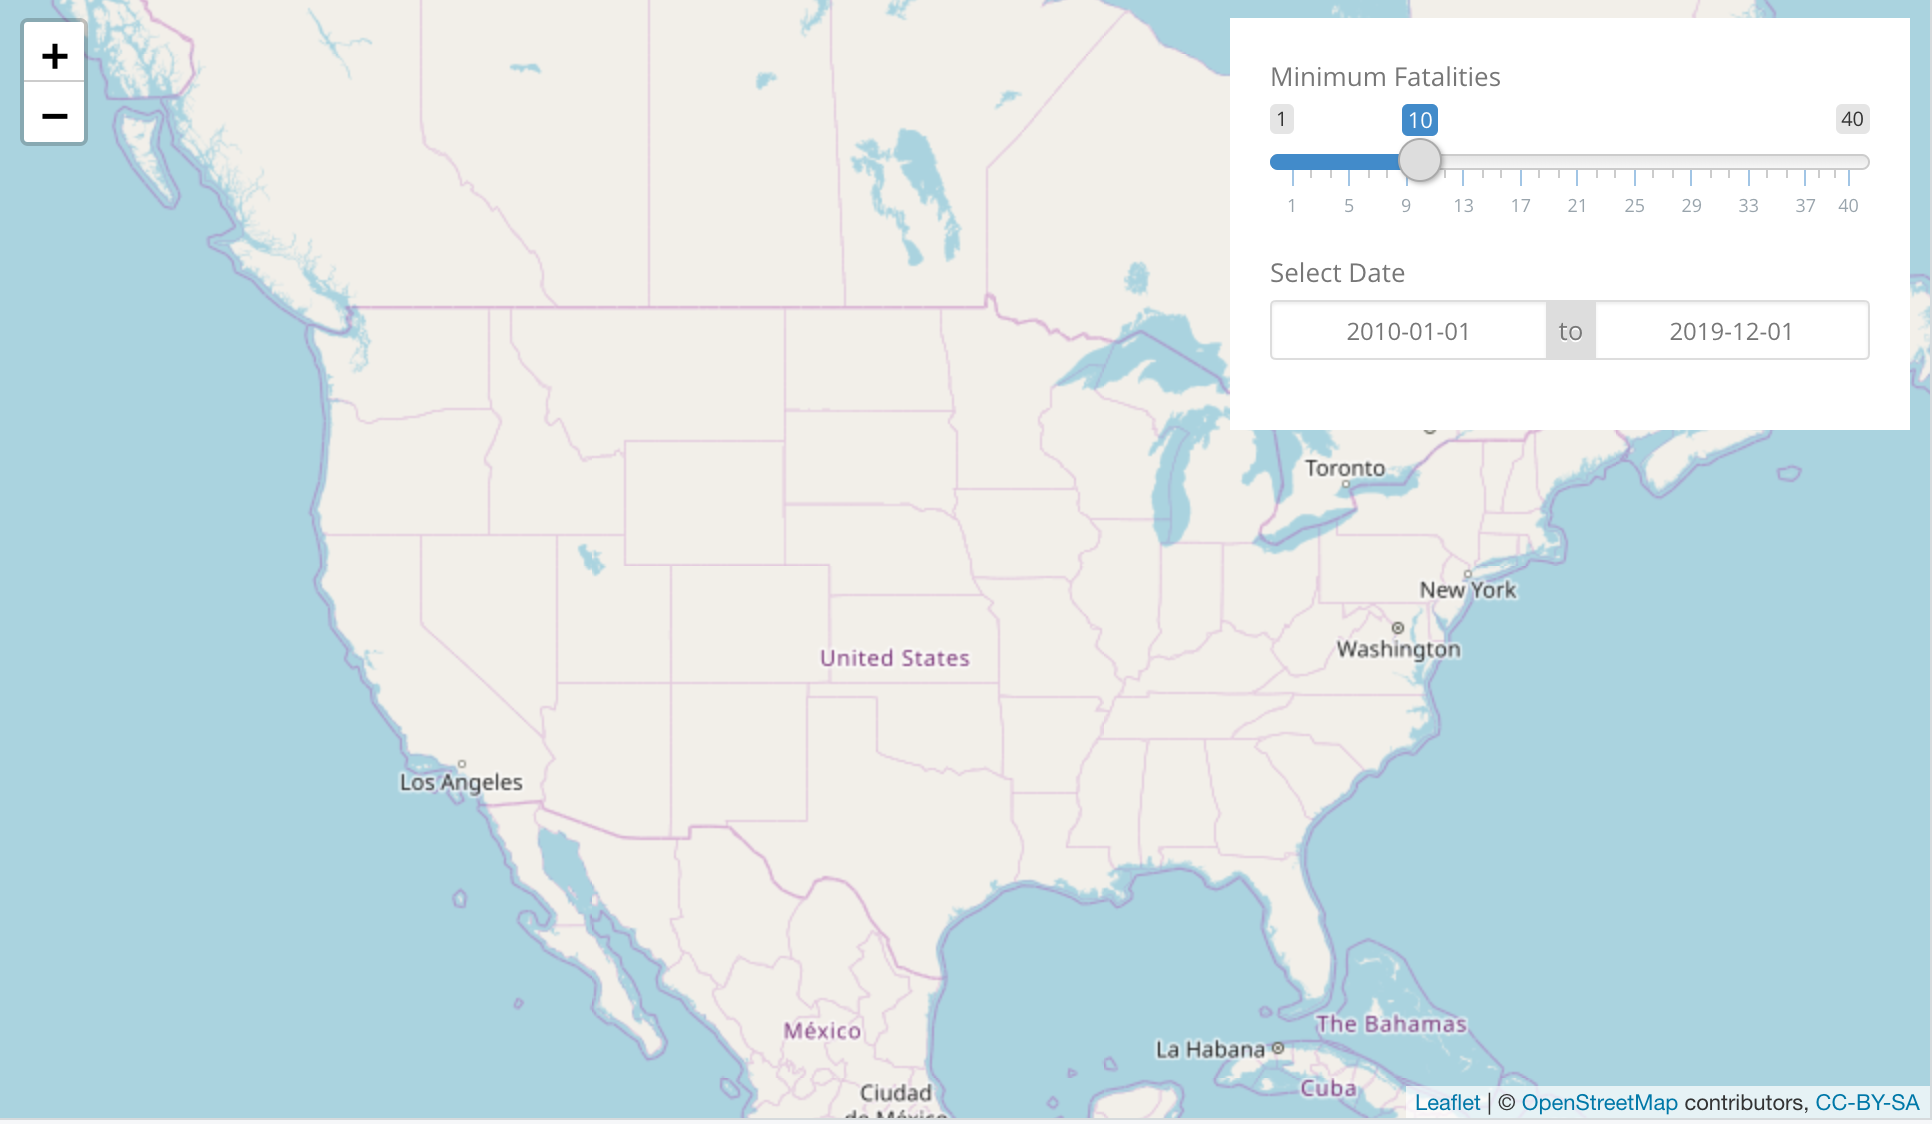
In this exercise, you will add a slider input to filter on fatalities and a
date range input to filter on a range of dates. Your app should resemble the
image in this screenshot.
We have already loaded the dataset mass_shootings, and the packages shiny,
dplyr, and leaflet.
This exercise is part of the course
Building Web Applications with Shiny in R
Exercise instructions
- Add a slider input named
nb_fatalitiesto filter the datasetmass_shootingson the number of fatalities. - Add a date range input named
date_rangeto filter on a range of dates.
Hands-on interactive exercise
Have a go at this exercise by completing this sample code.
ui <- bootstrapPage(
  theme = shinythemes::shinytheme('simplex'),
  leaflet::leafletOutput('map', height = '100%', width = '100%'),
  absolutePanel(top = 10, right = 10, id = 'controls',
    # CODE BELOW: Add slider input named nb_fatalities

    # CODE BELOW: Add date range input named date_range

  ),
  tags$style(type = "text/css", "
    html, body {width:100%;height:100%}
    #controls{background-color:white;padding:20px;}
  ")
)

server <- function(input, output, session) {
  output$map <- leaflet::renderLeaflet({
    leaflet() %>%
      addTiles() %>%
      setView( -98.58, 39.82, zoom = 5) %>%
      addTiles()
  })
}

shinyApp(ui, server)