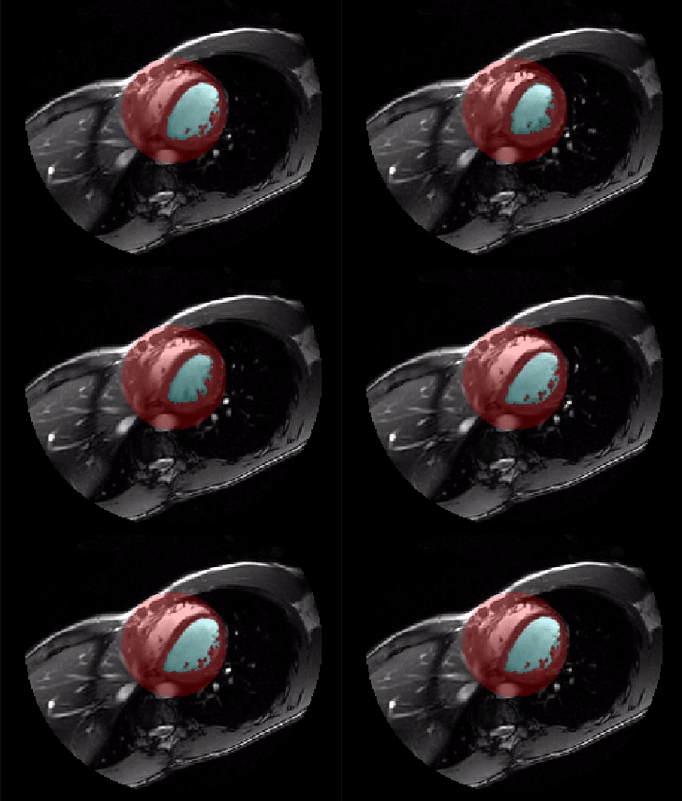
Summarize the time series
The ejection fraction is the proportion of blood squeezed out of the left ventricle each heartbeat. To calculate it, radiologists have to identify the maximum volume (systolic volume) and the minimum volume (diastolic volume) of the ventricle.

For this exercise, create a time series of volume calculations. There are 20 time points in both vol_ts and labels. The data is ordered by (time, plane, row, col).
This exercise is part of the course
Biomedical Image Analysis in Python
Exercise instructions
- Initialize an empty array with 20 elements using
np.zeros(). - Calculate the volume of each image voxel. (Consult the
metadictionary for sampling rates.) - For each time point, count the pixels in
labels, and update the time series array. - Plot the time series using
plt.plot().
Hands-on interactive exercise
Have a go at this exercise by completing this sample code.
# Create an empty time series
ts = ____

# Calculate volume at each voxel
d0, d1, d2, d3 = ____
dvoxel = ____

# Loop over the labeled arrays
for t in range(20):
    nvoxels = ____
    ts[t] = ____

# Plot the data
____
format_and_render_plot()