Preparing data for a facet grid plot
In this exercise, you will prepare the data to make this plot:
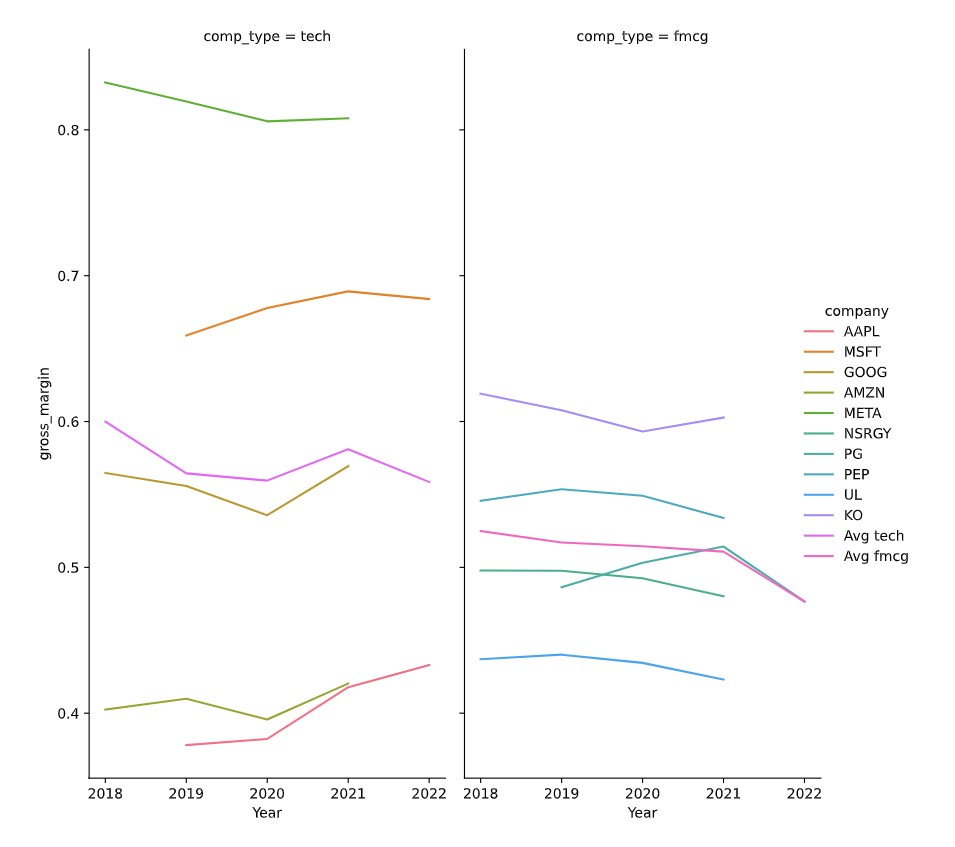 In the next exercise, you'll practice making the plot. This is a neat plot to observe:
- The gross margin of tech companies is more spread out than those of FMCG companies
- Year by year, how profitable a company is compared to the average company in its industry.
pandas is loaded with the alias pd and seaborn is loaded with the alias sns. A pandas DataFrame dataset is loaded for you which already has a gross_margin column computed.
This exercise is part of the course
Analyzing Financial Statements in Python
Hands-on interactive exercise
Have a go at this exercise by completing this sample code.
# Subset tech and fmcg companies
subset_dat = dataset.loc[____]